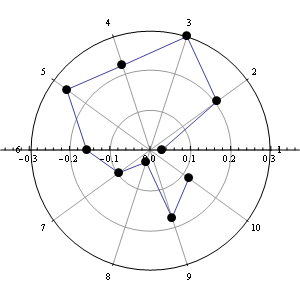
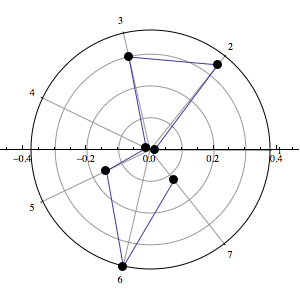
I have created a ListPolarPlot using the code below. I need to label the lines that extend from the centre to the outer ring. I do not want to label them with the values that these lines represent but rather with the values 1 to 7. I have tried LabelingFunction and some other things but these options don't work for ListPolarPlot. Can anyone help me with this ?
As a second best solution I could just label the plotted points themselves from 1 to 7 (starting at the right hand horizontal and working anticlockwise).
ListPolarPlot[
 Tooltip /@ {0.01422, 0.3425217, 0.30036, 0.013, 0.152, 0.3762,
   0.122}, Joined -> True,
 PlotMarkers -> Graphics@Disk[{0, 0}, Scaled[0.025]],
 Axes -> {True, False}, PolarAxes -> Automatic,
 PolarGridLines -> {{0.897, 0.897*2, 0.897*3, 0.897*4, 0.897*5,
    0.897*6, 0.897*7}, {0.1, 0.2, 0.3}}, PolarTicks -> None,
 AspectRatio -> 1/1, ImageSize -> {300, 300}]


