5
$\begingroup$

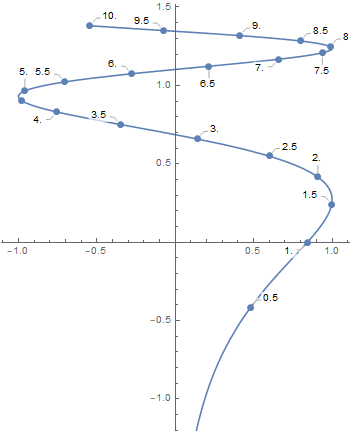
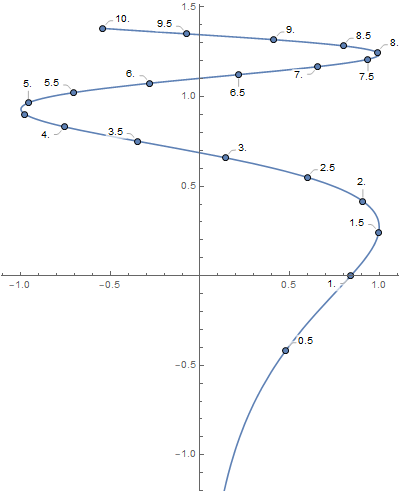
Is it possible to add to the Mesh points in a ParametricPlot the x-values in sort of a Callout-style way? E.g. on the following simple function:

ParametricPlot[{Sin@x, .3 Log@(x^2)}, {x, 0, 10}, Mesh -> 20]

The points are on the plot (a little small), now there should be the x values (0,0.5,1,1.5,...) indicated next to the points, as said in form of as it is produced with Callout.

$\endgroup$
1
  • $\begingroup$ This might help: link $\endgroup$
    – K.J.
    Commented Nov 20, 2018 at 15:04

2 Answers 2

9
$\begingroup$
pp = ParametricPlot[{Sin@x, .3 Log@(x^2)}, {x, 0, 10}, 
   Mesh -> {Subdivide[0, 10, 20]}, MeshStyle -> PointSize[Large]];
points = Cases[Normal[pp], Point[x_] :> x, ∞];
Show[pp, ListPlot[Callout[#, #2] & @@@ 
  Transpose[{SortBy[points, Last], N @ Rest@Subdivide[0, 10, 20]}]], ImageSize -> 400]

enter image description here

Also

ParametricPlot[{Sin@x, .3 Log@(x^2)}, {x, 0, 10}, 
 Epilog -> ListPlot[Callout[{##2}, #] & @@@ 
   Table[N@{x, Sin@x, .3 Log @ (x^2)}, {x, Subdivide[0, 10, 20]}], 
  PlotStyle -> PointSize[Large]][[1]]]

enter image description here

$\endgroup$
0
6
$\begingroup$

Using Epilog

ParametricPlot[{Sin@x, .3 Log@(x^2)}, {x, 0, 10}, 
 Epilog -> {AbsolutePointSize[4], 
    {Text[N[#], pt = {Sin@#, .3 Log@(#^2)}, {0, If[IntegerQ[#], -2, 2]}], 
      Red, Point[pt]} & /@ Range[1/2, 10, 1/2]}]

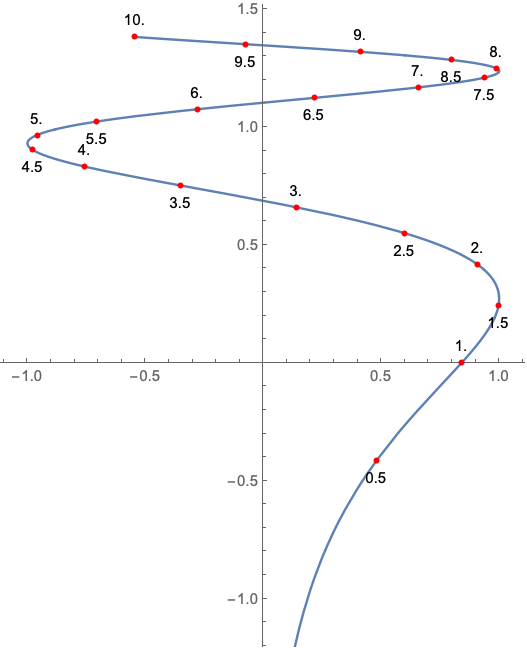
enter image description here

$\endgroup$

Your Answer

By clicking “Post Your Answer”, you agree to our terms of service and acknowledge you have read our privacy policy.

Not the answer you're looking for? Browse other questions tagged or ask your own question.