deleted 44 characters in body
Source Link
kglr
  • 400.5k
  • 18
  • 488
  • 929
pp = ParametricPlot[{Sin@x, .3 Log@(x^2)}, {x, 0, 10}, 
   Mesh -> {Subdivide[0, 10, 20]}, 
   MeshStyle -> Directive[ColorData[97]@1, PointSize[Large]]];PointSize[Large]];
points = Cases[Normal[pp], Point[x_] :> x, ∞];
Show[pp, ListPlot[Callout[#, #2] & @@@ 
   Transpose[{SortBy[points, Last], N @ Rest@Subdivide[0, 10, 20]}]], 
  ImageSize -> 400]

enter image description hereenter image description here

Also

ParametricPlot[{Sin@x, .3 Log@(x^2)}, {x, 0, 10}, 
 Epilog -> ListPlot[Callout[{##2}, #] & @@@ 
   Table[N@{x, Sin@x, .3 Log @ (x^2)}, {x, Subdivide[0, 10, 20]}], 
  PlotStyle -> PointSize[Large]][[1]]]

enter image description here

pp = ParametricPlot[{Sin@x, .3 Log@(x^2)}, {x, 0, 10}, 
   Mesh -> {Subdivide[0, 10, 20]}, 
   MeshStyle -> Directive[ColorData[97]@1, PointSize[Large]]];
points = Cases[Normal[pp], Point[x_] :> x, ∞];
Show[pp, ListPlot[Callout[#, #2] & @@@ 
   Transpose[{SortBy[points, Last], N @ Rest@Subdivide[0, 10, 20]}]], 
  ImageSize -> 400]

enter image description here

Also

ParametricPlot[{Sin@x, .3 Log@(x^2)}, {x, 0, 10}, 
 Epilog -> ListPlot[Callout[{##2}, #] & @@@ 
   Table[N@{x, Sin@x, .3 Log @ (x^2)}, {x, Subdivide[0, 10, 20]}], 
  PlotStyle -> PointSize[Large]][[1]]]
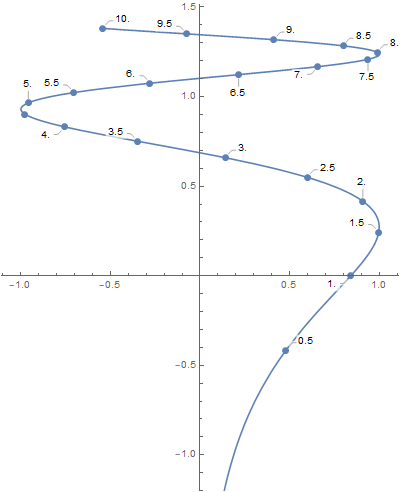
enter image description here

pp = ParametricPlot[{Sin@x, .3 Log@(x^2)}, {x, 0, 10}, 
   Mesh -> {Subdivide[0, 10, 20]}, MeshStyle -> PointSize[Large]];
points = Cases[Normal[pp], Point[x_] :> x, ∞];
Show[pp, ListPlot[Callout[#, #2] & @@@ 
  Transpose[{SortBy[points, Last], N @ Rest@Subdivide[0, 10, 20]}]], ImageSize -> 400]

enter image description here

Also

ParametricPlot[{Sin@x, .3 Log@(x^2)}, {x, 0, 10}, 
 Epilog -> ListPlot[Callout[{##2}, #] & @@@ 
   Table[N@{x, Sin@x, .3 Log @ (x^2)}, {x, Subdivide[0, 10, 20]}], 
  PlotStyle -> PointSize[Large]][[1]]]
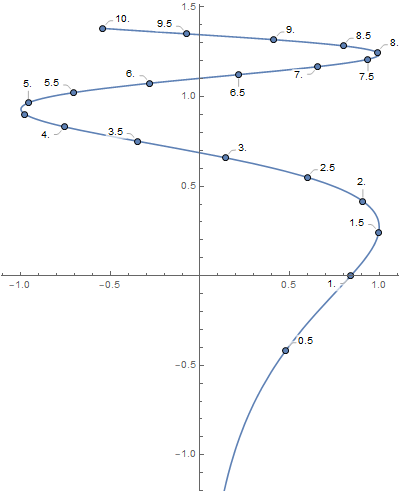
enter image description here

added 109 characters in body
Source Link
kglr
  • 400.5k
  • 18
  • 488
  • 929
pp = ParametricPlot[{Sin@x, .3 Log@(x^2)}, {x, 0, 10}, 
   Mesh -> 20{Subdivide[0, 10, 20]}, 
   MeshStyle -> Directive[ColorData[97]@1, PointSize[Large]]];
points = Cases[Normal[pp], Point[x_] :> x, ∞];
Show[pp, ListPlot[Callout[#, #[[1]]]#2] & /@@@ 
   Transpose[{SortBy[points, Last], N @ points]Rest@Subdivide[0, 10, 20]}]], 
  ImageSize -> 400]

enter image description hereenter image description here

Also

ParametricPlot[{Sin@x, .3 Log@(x^2)}, {x, 0, 10}, 
 Epilog -> ListPlot[Callout[{##2}, #] & @@@ 
   Table[N@{x, Sin@x, .3 Log @ (x^2)}, {x, Subdivide[0, 10, 20]}], 
  PlotStyle -> PointSize[Large]][[1]]]
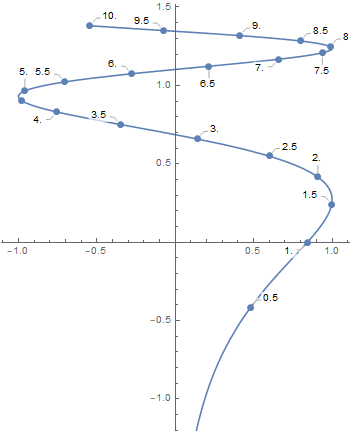
enter image description here

pp = ParametricPlot[{Sin@x, .3 Log@(x^2)}, {x, 0, 10}, Mesh -> 20, 
   MeshStyle -> Directive[ColorData[97]@1, PointSize[Large]]];
points = Cases[Normal[pp], Point[x_] :> x, ∞];
Show[pp, ListPlot[Callout[#, #[[1]]] & /@ points], ImageSize -> 400]

enter image description here

Also

ParametricPlot[{Sin@x, .3 Log@(x^2)}, {x, 0, 10}, 
 Epilog -> ListPlot[Callout[{##2}, #] & @@@ 
   Table[N@{x, Sin@x, .3 Log @ (x^2)}, {x, Subdivide[0, 10, 20]}], 
  PlotStyle -> PointSize[Large]][[1]]]
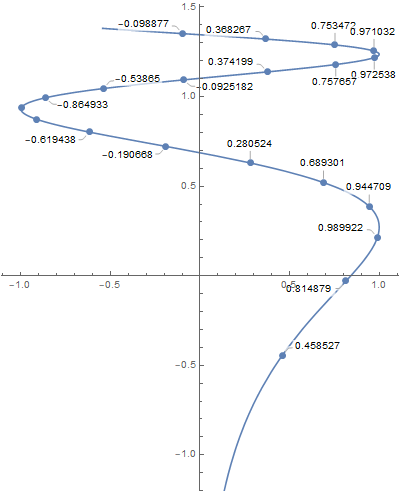
enter image description here

pp = ParametricPlot[{Sin@x, .3 Log@(x^2)}, {x, 0, 10}, 
   Mesh -> {Subdivide[0, 10, 20]}, 
   MeshStyle -> Directive[ColorData[97]@1, PointSize[Large]]];
points = Cases[Normal[pp], Point[x_] :> x, ∞];
Show[pp, ListPlot[Callout[#, #2] & @@@ 
   Transpose[{SortBy[points, Last], N @ Rest@Subdivide[0, 10, 20]}]], 
  ImageSize -> 400]

enter image description here

Also

ParametricPlot[{Sin@x, .3 Log@(x^2)}, {x, 0, 10}, 
 Epilog -> ListPlot[Callout[{##2}, #] & @@@ 
   Table[N@{x, Sin@x, .3 Log @ (x^2)}, {x, Subdivide[0, 10, 20]}], 
  PlotStyle -> PointSize[Large]][[1]]]
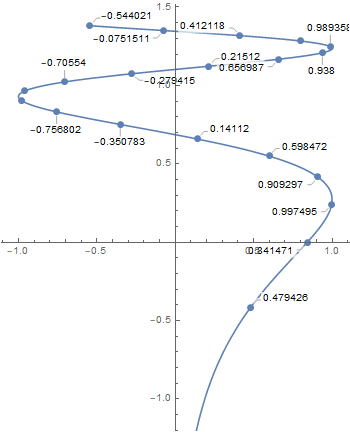
enter image description here

added 1 character in body
Source Link
kglr
  • 400.5k
  • 18
  • 488
  • 929
pp = ParametricPlot[{Sin@x, .3 Log@(x^2)}, {x, 0, 10}, Mesh -> 20, 
   MeshStyle -> Directive[ColorData[97]@1, PointSize[Large]]];
points = Cases[Normal[pp], Point[x_] :> x, ∞];
Show[pp, ListPlot[Callout[#, #[[1]]] & /@ points], ImageSize -> 400]

enter image description here

Also

ParametricPlot[{Sin@x, .3 Log@(x^2)}, {x, 0, 10}, 
 Epilog -> ListPlot[Callout[#ListPlot[Callout[{##2}, #[[1]]]#] & /@@@@ 
     Table[N@{x, Sin@x, .3 Log@Log @ (x^2)}, {x, Subdivide[0, 10, 20]}], 
    PlotStyle -> PointSize[Large]][[1]]]

enter image description hereenter image description here

pp = ParametricPlot[{Sin@x, .3 Log@(x^2)}, {x, 0, 10}, Mesh -> 20, 
   MeshStyle -> Directive[ColorData[97]@1, PointSize[Large]]];
points = Cases[Normal[pp], Point[x_] :> x, ∞];
Show[pp, ListPlot[Callout[#, #[[1]]] & /@ points], ImageSize -> 400]

enter image description here

Also

ParametricPlot[{Sin@x, .3 Log@(x^2)}, {x, 0, 10}, 
 Epilog -> ListPlot[Callout[#, #[[1]]] & /@ 
     Table[N@{Sin@x, .3 Log@(x^2)}, {x, Subdivide[0, 10, 20]}], 
    PlotStyle -> PointSize[Large]][[1]]]

enter image description here

pp = ParametricPlot[{Sin@x, .3 Log@(x^2)}, {x, 0, 10}, Mesh -> 20, 
   MeshStyle -> Directive[ColorData[97]@1, PointSize[Large]]];
points = Cases[Normal[pp], Point[x_] :> x, ∞];
Show[pp, ListPlot[Callout[#, #[[1]]] & /@ points], ImageSize -> 400]

enter image description here

Also

ParametricPlot[{Sin@x, .3 Log@(x^2)}, {x, 0, 10}, 
 Epilog -> ListPlot[Callout[{##2}, #] & @@@ 
   Table[N@{x, Sin@x, .3 Log @ (x^2)}, {x, Subdivide[0, 10, 20]}], 
  PlotStyle -> PointSize[Large]][[1]]]

enter image description here

added 319 characters in body
Source Link
kglr
  • 400.5k
  • 18
  • 488
  • 929
Loading
Source Link
kglr
  • 400.5k
  • 18
  • 488
  • 929
Loading