2
$\begingroup$

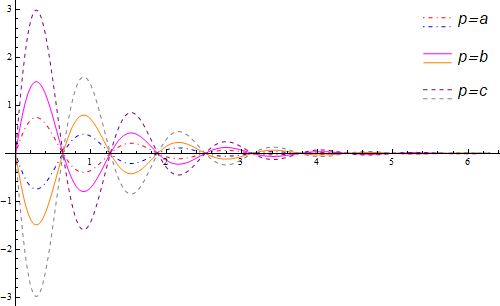
I have the following plot showing six curves. The curves "DotDashed Blue and Red" correspond to p=a, "Solid Orange and Magenta" correspond to p=b, and, "Dashed Purple and Gray" correspond to p=c. I want to label these cases in a single Legend as shown

p1 = Plot[{Exp[-x] Sin[5 x], -Exp[-x] Sin[5 x]}, {x, 0, 2 \[Pi]}, 
   PlotRange -> All, 
   PlotStyle -> {{Red, DotDashed}, {Blue, DotDashed}}];
p2 = Plot[{2 Exp[-x] Sin[5 x], -2 Exp[-x] Sin[5 x]}, {x, 0, 2 \[Pi]}, 
   PlotRange -> All, PlotStyle -> {Magenta, Orange}];
p3 = Plot[{4 Exp[-x] Sin[5 x], -4 Exp[-x] Sin[5 x]}, {x, 0, 2 \[Pi]}, 
   PlotRange -> All, PlotStyle -> {{Purple, Dashed}, {Gray, Dashed}}];

join = Show[p3, p2, p1];

Needs["PlotLegends`"]
ShowLegend[
 Show[join, 
  ImageSize -> 
   300], {{{Graphics[{{Red, Blue}, DotDashed, Thickness[0.115], 
      Line[{{0, 0}, {2, 0}}]}], 
    Style["p=a", FontFamily -> "Arial", Italic, 
     FontSize -> 8]}, {Graphics[{{Purple, Orange}, Thickness[0.115], 
      Line[{{0, 0}, {2, 0}}]}], 
    Style["p=b", FontFamily -> "Arial", Italic, 
     FontSize -> 8]}, {Graphics[{{Magenta, Gray}, Dashed, 
      Thickness[0.115], Line[{{0, 0}, {2, 0}}]}], 
    Style["p=c", FontFamily -> "Arial", Italic, FontSize -> 8]}}, 
  LegendLabel -> "" , LegendPosition -> {0.461, 0.340}, 
  LegendSize -> {0.45, 0.3}, LegendShadow -> False}]
$\endgroup$
3
  • $\begingroup$ What is you Mathematica version exactly? $\endgroup$
    – halirutan
    Commented Feb 2, 2018 at 9:31
  • $\begingroup$ Hi, I am using Mathematica 10. $\endgroup$
    – H. Kenan
    Commented Feb 2, 2018 at 9:41
  • $\begingroup$ Have you seen, that PlotLegends are built-in since version 9.0? $\endgroup$
    – halirutan
    Commented Feb 2, 2018 at 9:46

1 Answer 1

6
$\begingroup$

Using the function pair from this answer as the setting for LegendLayout:

pair = Grid[MapAt[SpanFromAbove &, #, {2 ;; ;; 2, 2}], 
   Alignment -> {Center, Center}, Spacings -> {1/2, {{1, -0.5}}}] &;

labels = Style[#, 16, FontFamily->"Arial", Italic] & /@ {"p=a", "p=b", "p=c"};
styles = {{Red, DotDashed}, {Blue, DotDashed}, Magenta, Orange, 
   {Purple, Dashed}, {Gray, Dashed}};
funcs = Join @@ ({#, -#} & /@ ( Exp[-x] Sin[5 x] 2^Range[0, 2]));

Plot[funcs, {x, 0, 2 π}, PlotRange -> All, ImageSize -> 500, PlotStyle -> styles, 
 PlotLegends -> Placed[LineLegend[Riffle[labels, labels], 
    LegendLayout -> pair, LegendMarkerSize -> {30, 15}], {Right, Top}]]

enter image description here

$\endgroup$
3
  • $\begingroup$ thanks. Can't we have this Legend inside the Figure? $\endgroup$
    – H. Kenan
    Commented Feb 2, 2018 at 10:10
  • $\begingroup$ @user149973, please see the update. $\endgroup$
    – kglr
    Commented Feb 2, 2018 at 10:21
  • $\begingroup$ thank you so much. $\endgroup$
    – H. Kenan
    Commented Feb 2, 2018 at 10:43

Your Answer

By clicking “Post Your Answer”, you agree to our terms of service and acknowledge you have read our privacy policy.

Not the answer you're looking for? Browse other questions tagged or ask your own question.