1
$\begingroup$

I would like to create a so called Stacked Plot type of view to display a combination of data. Perhaps there already is a built in function in Mathematica, but I didn't manage to find it. So, I decided to simply shift the X and Y axis values of plots by a certain value and combine them using Show. Here is the example code how I tried to do it:

Do[
 Subscript[data, i] = Table[{x, Sin[x + i] + 2*i}, {x, 0, 10, 0.1}];
 Subscript[lpl, i] = ListLinePlot[Subscript[data, i], PlotRange -> {{0 + 0.1*i, 10 - 0.1*(10 - i)}, {-1.2, 22.2}}]
, {i, 0, 10}];
Show[Table[Subscript[lpl, i], {i, 0, 10}], Axes -> None, Frame -> {{None, None}, {True, None}}, PlotRange -> {{-0.1, 10.1}, {-1.2, 22.2}}]

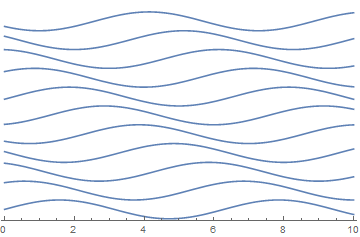
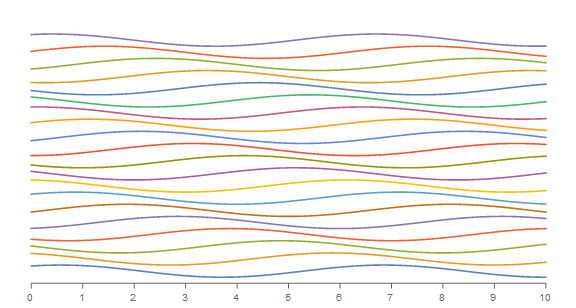
You can see, that I shifted the x values of PlotRange of each consequent plot by a certain value. However, in the output all of the plots seem to have the same PlotRange values. The resultant output looks pretty rectangular, like this:

Output

Here are the questions:

  1. Is it possible to combine several ListLinePlots having different PlotRange values using Show so, that they retain their individual PlotRanges, i.e. will be clipped in a combined plot?
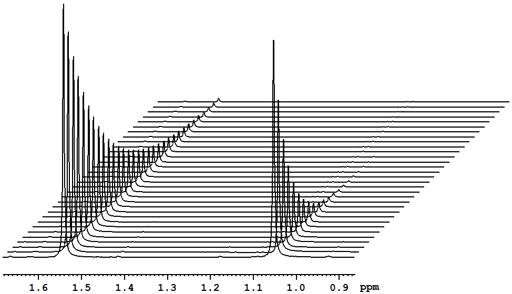
  2. Perhaps there is another, better solution to make a Stacked Plot? Here is an example of how a Stacked plot I am aiming for looks like: enter image description here
$\endgroup$
1

3 Answers 3

3
$\begingroup$
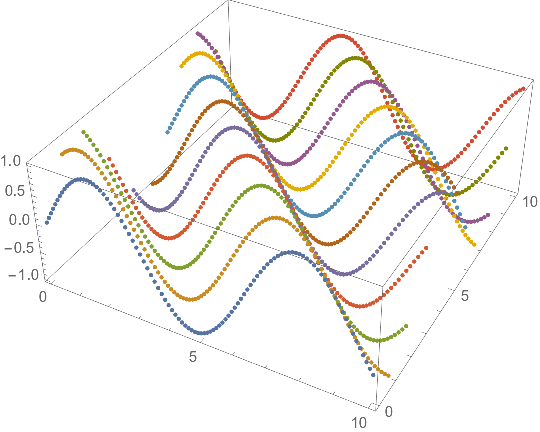
data = Table[{x, i, Sin[x + i]}, {i, 0, 10}, {x, 0, 10, 0.1}];

ListPointPlot3D[Evaluate@data]

enter image description here

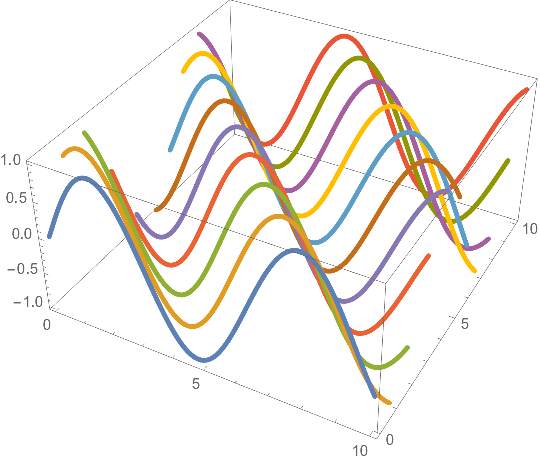
Graphics3D[{AbsoluteThickness[3.25],
  Transpose[{
    Table[ColorData[97][n], {n, Length[data]}],
    Line /@ data}]},
 BoxRatios -> {1, 1, 1/2},
 Axes -> True]

enter image description here

$\endgroup$
0
2
$\begingroup$

If I understand you right (if not, please let me know, and will delete this), you want to combine the plots but each have it own plot range.

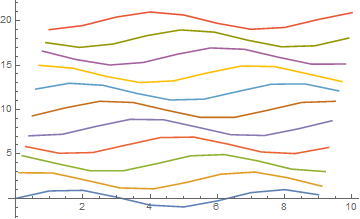
I would not use Show. Just use ListLinePlot. Show takes information from the first graphic object it is given. So I would simply do

Do[data[i]=Table[{x,Sin[x+i]+2 i},{x,0+0.1 i,10-0.1 (10-i)}],{i,0,10}];
ListLinePlot[data[#]&/@Range[0,10]]

Mathematica graphics

ps. I changed your subscripts with indexed, as it is easier to type for me.

$\endgroup$
1
  • $\begingroup$ It is indeed one way to achieve the result, but it involves manipulation of data. As one consequence, in this particular example, the number of data points in your code and mine is different -- each curve in my plot consist of 101 data point, in yours -- only 10. I understand that your code can be modified so that we have equal data sizes. But perhaps there is a way to do it without data manipulation? It is that in real application data sizes are quite huge. Usually I need to make a stack of more than 10 plots with 32k points each. $\endgroup$
    – Bulat
    Commented Oct 22, 2017 at 15:58
0
$\begingroup$

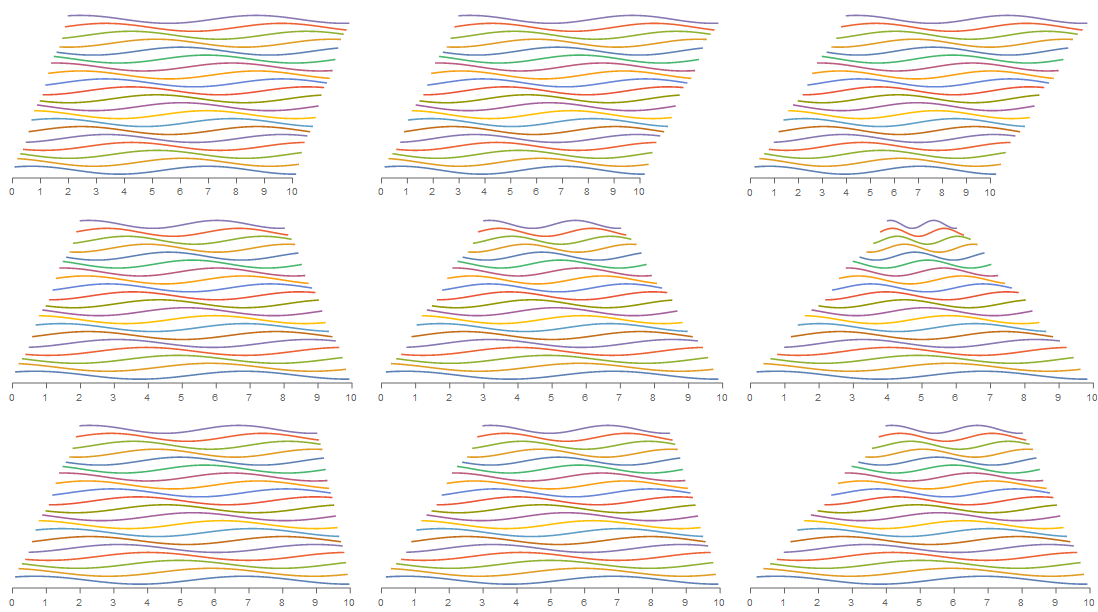
You can use TemporalData to construct your input data and then use TimeSeriesRescale on individual time series to get a perspective look/feel:

numberofseries = 20;

tds = Table[TemporalData[Table[Sin[x + i] + 2*i, {x, 0, 10, 0.1}], {0, 10}],
   {i, numberofseries}];

ClearAll[xaxis]
xaxis[a_, b_] := {GrayLevel[.4], Thickness -> Absolute[0.2], 
     {Line[#[[{1, -1}]]], Line[{#, Offset[{0, -5}, #]}] & /@ #, 
      Text[#[[1]], Offset[{0, -15}, #]] & /@ #} & @ Thread[{Range[a, b], 0}]};

ListLinePlot[tds, ImageSize -> Large, Axes -> False, 
 Epilog -> xaxis[0, 10], AspectRatio -> 1/2, ImagePadding -> 20, 
 PlotRangeClipping -> False, Ticks -> {Range[0, 10], All}]

enter image description here

ClearAll[rescaleTD]
rescaleTD[ls_: .1, rs_: .1] := MapIndexed[TimeSeriesRescale[#, 
   Flatten[# /@ {"FirstTimes", "LastTimes"}] + {ls, rs} #2[[1]]] &, #] &;

Grid @ Transpose @ 
    (ListLinePlot[#, ImageSize -> 360, Axes -> False, 
        Epilog -> xaxis[0, 10], AspectRatio -> 1/2, 
        ImagePadding -> {{5, 5}, {20, 5}}, 
        PlotRangeClipping -> False, Ticks -> {Range[0, 10], All}] & /@
     Through[{rescaleTD[#, #], rescaleTD[#, -#], rescaleTD[#, -#/2]} @ tds] & /@ 
     {.1, .15, .2})

enter image description here

$\endgroup$

Your Answer

By clicking “Post Your Answer”, you agree to our terms of service and acknowledge you have read our privacy policy.

Not the answer you're looking for? Browse other questions tagged or ask your own question.