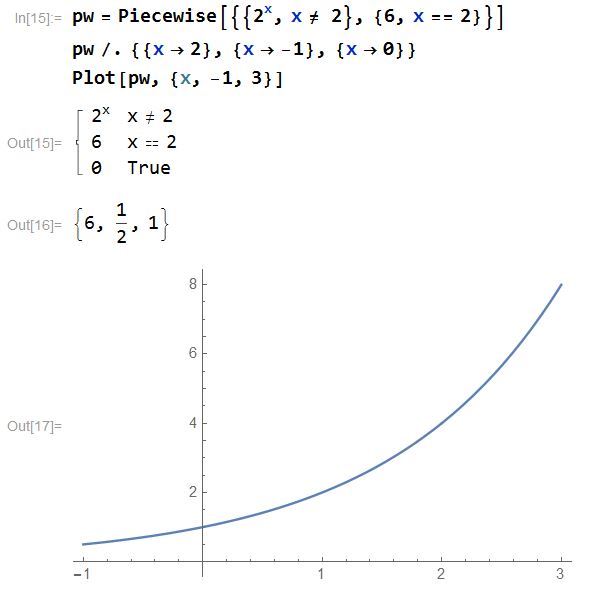
I though I will get a point at f(2)=6, anyone please help me I am new on programming, Thanks
1 Answer
$\begingroup$
$\endgroup$
There is nothing wrong with your piecewise function, but Mathematica's plotting algorithm really can't show an intervals are less than single pixel. A single real number, which has measure zero, simply doesn't show up. There are ways to deal with the problem. Here are two. One of them may be what you want.
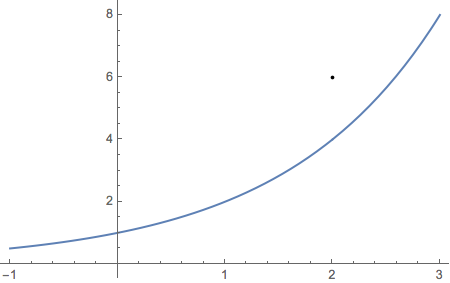
Force Plot to draw the point.
pw1[x_] := Piecewise[{{2^x, x != 2}}, 6]
Plot[pw1[ x], {x, -1, 3}, Epilog -> {Point[{2, pw1[2]}]}]
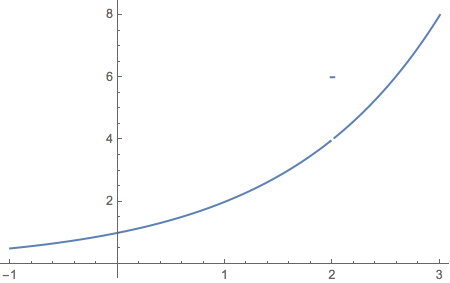
Redefine the function so it takes the value 6 over a large enough interval.
With[{d = .015},
  With[{span = 2 + {-1, 1} d},
    pw2[x_] := Piecewise[{{6, Between[x, span]}}, 2^x]]]
Plot[pw2[x], {x, -1, 3}, PlotPoints -> 80]
Note that I had to ask for extra plot points to get the small interval to show up.


Plotworks by discretely sampling the function. This would only work in the unlikely eventPlothappens to sample exactly atx=2. Best bet here is to just useEpilog->Point[{2,6}]$\endgroup${}button above the edit window. It is recommended that you browse the Markdown help $\endgroup$PlotPiecewise[Piecewise[{{2^x, x != 2}, {6, x == 2}}], {x, -1, 3}]. $\endgroup$