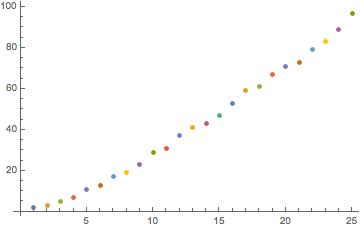
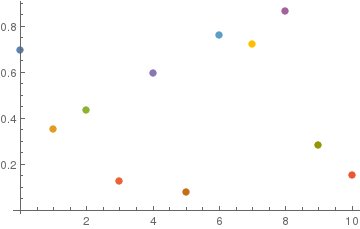
I would like to plot/scatter a few points, but each of them should be in different color. I need this, because color should store extra information, let's say OX means age, OY means hight and color of point indicates a person. Is it possible to do? Thanks for any help
Edit: Solved. Thank you for your answers. I decided to create ListPlot and treat every point as seperate plot, because it's important for me to remember which point represents which "person".


Graphics,Point$\endgroup$