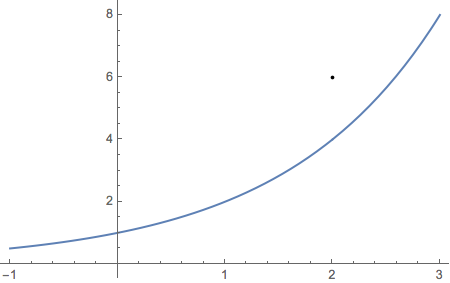
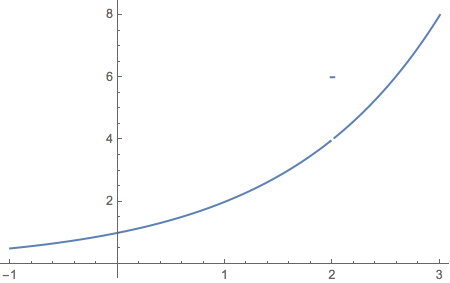
There is nothing wrong with your piecewise function, but Mathematica's plotting algorithm really can't show an intervals are less than single pixel. A single real number, which has measure zero, simply doesn't show up. There are ways to deal with the problem. Here are two. One of them may be what you want.
###Force Plot to draw the point.
Force Plot to draw the point.
pw1[x_] := Piecewise[{{2^x, x != 2}}, 6]
Plot[pw1[ x], {x, -1, 3}, Epilog -> {Point[{2, pw1[2]}]}]
###Redefine the function so it takes the value 6 over a large enough interval.
Redefine the function so it takes the value 6 over a large enough interval.
With[{d = .015},
  With[{span = 2 + {-1, 1} d},
    pw2[x_] := Piecewise[{{6, Between[x, span]}}, 2^x]]]
Plot[pw2[x], {x, -1, 3}, PlotPoints -> 80]
Note that I had to ask for extra plot points to get the small interval to show up.


