3
$\begingroup$

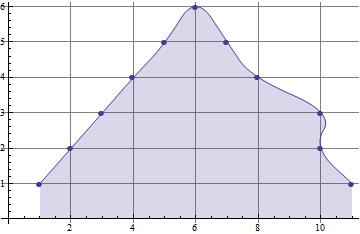
With

data = {{1, 1}, {2, 2}, {3, 3}, {4, 4}, {5, 5}, {6, 6}, {7, 5}, {8, 
   4}, {10, 3}, {10, 2}, {11, 1}}

and

ListLinePlot[data, Filling -> Axis, GridLines -> Automatic, 
 Joined -> True, Mesh -> Full, PlotMarkers -> Automatic, 
 InterpolationOrder -> 2]

we get:

enter image description here

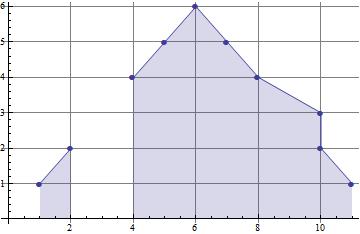
In reality, my datasets oftentimes have missing values. Setting f.e.

data[[3]] = {3, Missing[]}

I obtain with Off[ListLinePlot::ioproc] this picture,

enter image description here

nicely not-showing the missing point.

Unfortunately though, the smoothing vanished.

Could you propose a general way (plots may vary in size and may have multiple sets) to interpolate over missing values?

Thanks

EDIT

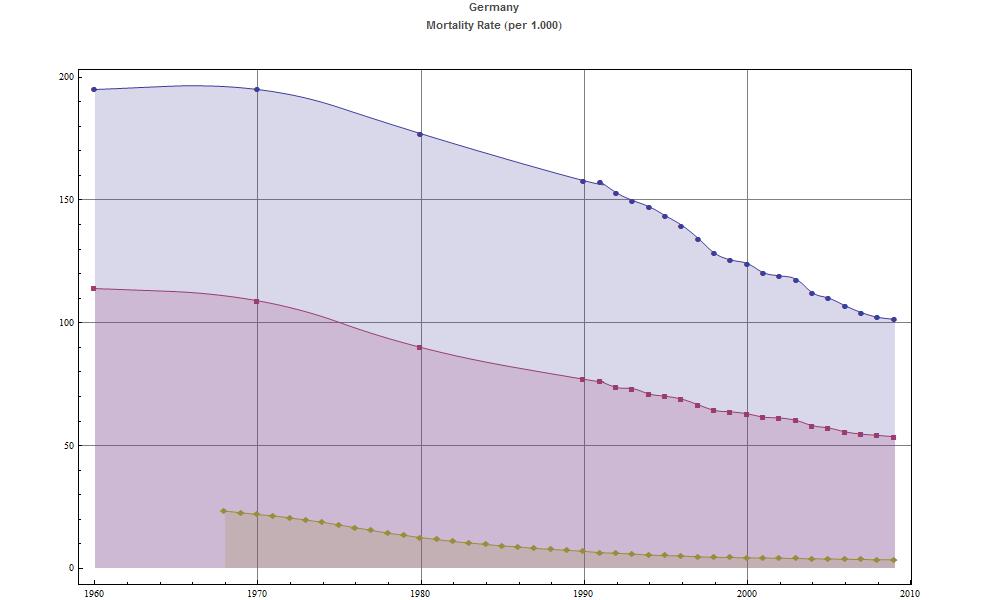
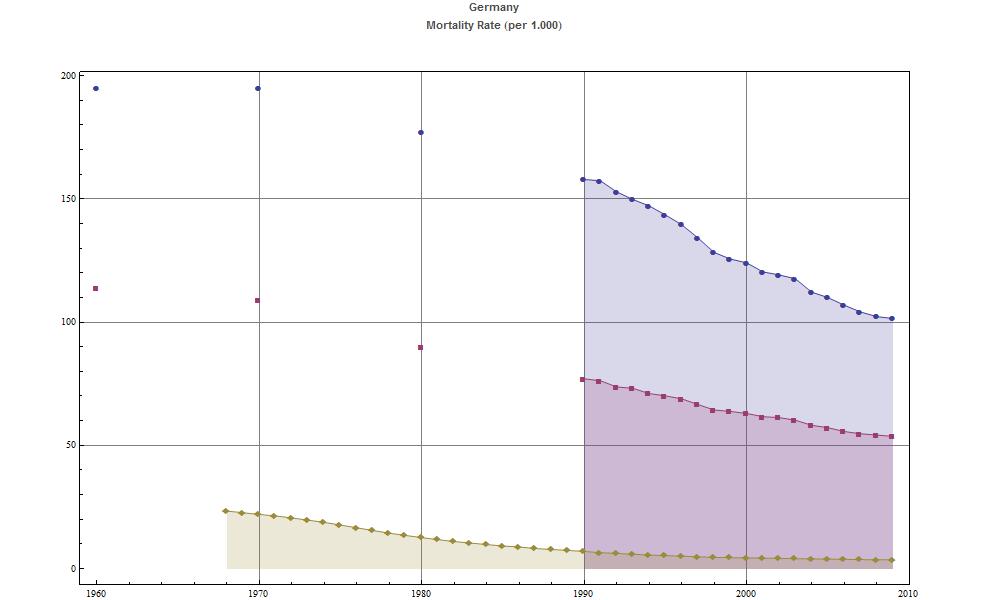
Based on the ideas presented here I have written this little function:

Smoother[v_] := If[smooth != 2, v, Select[#, #[[2]] != "na" &] & /@ v]

Turning Smoother on or off (via a button) I now get what I hoped for:

enter image description here

enter image description here

$\endgroup$
3
  • $\begingroup$ are you saying you want to keep the gap? Try using Split[] and plot the parts separately. $\endgroup$
    – george2079
    Commented May 24, 2014 at 13:13
  • $\begingroup$ Are the x values (data[[All,1]]) always sorted/non-decreasing as in your example? $\endgroup$
    – kglr
    Commented May 24, 2014 at 13:27
  • $\begingroup$ @kguler: Yes, they are. Actually, I made a mistake in my question: The x-values should have gone from 1 to 11 (I forgot the 9 and doubled the 10). $\endgroup$
    – eldo
    Commented May 24, 2014 at 13:34

4 Answers 4

4
$\begingroup$

Don't know how "general" you want it, but:

data = {{1, 1}, {2, 2}, {3, 3}, {4, 4}, {5, 5}, {6, 6},
   {7, 5}, {8, 4}, {10, 3}, {10, 2}, {11, 1}};
data1 = data;
data1[[3]] = {3, Missing[]};

GraphicsRow[ListLinePlot[#, Filling -> Axis, GridLines -> Automatic, 
   Joined -> True, Mesh -> Full, PlotMarkers -> Automatic, 
   InterpolationOrder -> 2] & /@ {data, Select[data1, #[[2]] =!= Missing[] &]}]

Mathematica graphics

$\endgroup$
1
  • $\begingroup$ nearly perfect, even better would be to leave the gap between 2 and 4 and smooth between 4 and 11. Thanks $\endgroup$
    – eldo
    Commented May 24, 2014 at 13:19
7
$\begingroup$

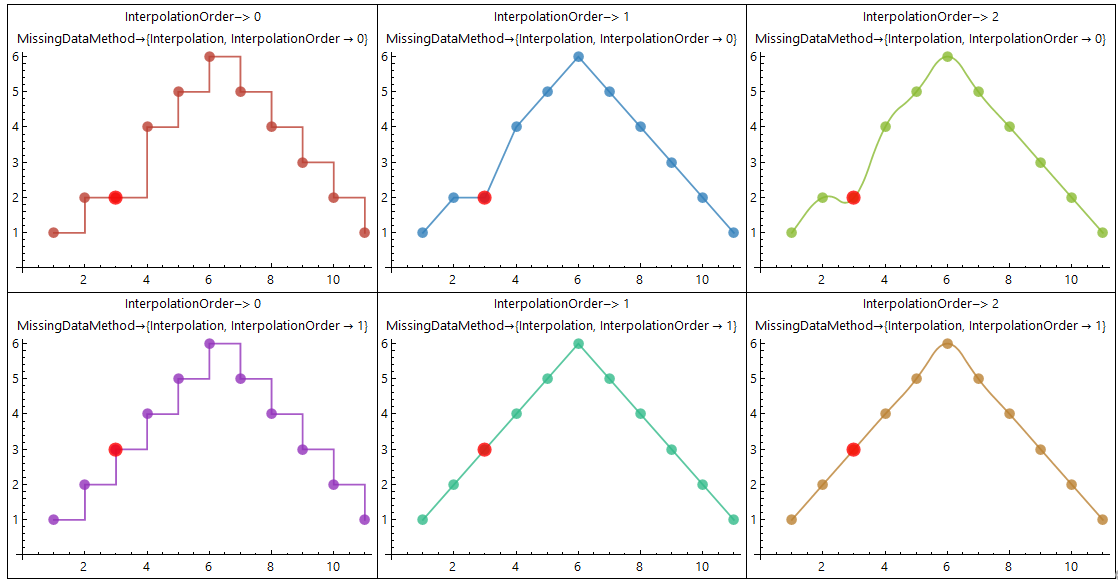
You can also use the new-in-9 built-in TemporalData which has the option MissingDataMethod to impute missing values.

dataOP = {{1, 1}, {2, 2}, {3, Missing[]}, {4, 4}, {5, 5}, {6, 6}, {7, 5},
          {8, 4}, {9, 3}, {10, 2}, {11, 1}};
states = dataOP[[All, 2]];
times = dataOP[[All, 1]];
style = {Joined -> True, Mesh -> Full, LabelStyle -> {"Panel", 14}, ImageSize -> 400};

tD = TemporalData[states, {times}, MissingDataMethod -> Automatic];
Row[Table[Quiet@ListLinePlot[dt, style, PlotStyle -> Directive[{PointSize[.03], Thick}],
                InterpolationOrder -> 2], {dt, {dataOP, tD}}],  Spacer[5]]

enter image description here

Default setting for InterpolationOrder suboption seems to be 0.

{td1, td2, td3} = TemporalData[states, {times},
        MissingDataMethod -> {"Interpolation",InterpolationOrder -> #}] & /@ {0, 1, 2};
Grid[i = 1; Table[Quiet@ListLinePlot[dt, style, InterpolationOrder -> io,
  PlotStyle -> Directive[{PointSize[.03], Thick, Opacity[.8],
                         ColorData[63, "ColorList"][[i++]]}],
  PlotLabel -> Style[StringForm["InterpolationOrder-> `1`\nMissingDataMethod->`2`",
         io, MissingDataMethod /. dt[[2, -1]]], 14]] /. 
    Point[x : {__}] :> {Point[x], Red, PointSize[.04], Point[x[[3]]]},
{dt, {td1, td2}}, {io, {0, 1, 2}}], Dividers -> All]
enter image description here

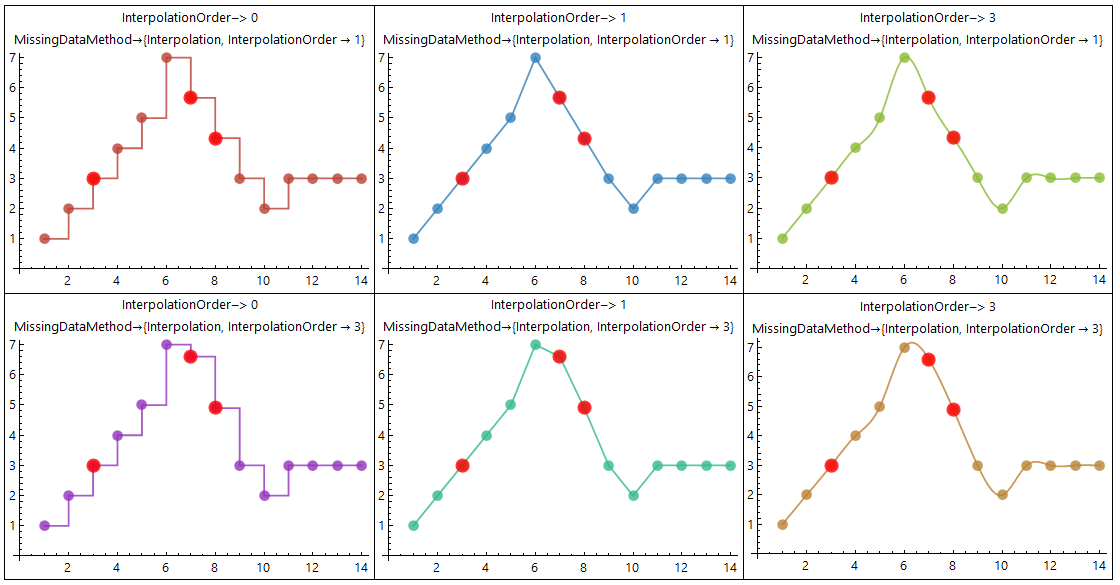
With modified data with more missing values, the effect of the suboption values become more visible:

dataA = {{1, 1}, {2, 2}, {3, Missing[]}, {4, 4}, {5, 5}, {6, 7}, {7, Missing[]}, 
         {8, Missing[]}, {9, 3}, {10, 2}, {11, 3}, {12, 3}, {13, 3}, {14, 3}};
statesA = dataA[[All, 2]];
timesA = dataA[[All, 1]];
{td1A, td2A, td3A} =  TemporalData[statesA, {timesA}, 
      MissingDataMethod -> {"Interpolation",  InterpolationOrder -> #}] & /@ {0, 1, 3};

Grid[i = 1; Table[Quiet@ ListLinePlot[dt, style, InterpolationOrder -> io,
    PlotStyle -> Directive[{PointSize[.03], Thick, Opacity[.8], 
          ColorData[63, "ColorList"][[i++]]}], 
  PlotLabel -> Style[StringForm["InterpolationOrder-> `1`\nMissingDataMethod->`2`",
         io, MissingDataMethod /. dt[[2, -1]]], 14]] /. 
    Point[x : {__}] :> {Point[x], Red, PointSize[.04], Point[x[[{3, 7, 8}]]]}, 
 {dt, {td2A, td3A}}, {io, {0, 1, 3}}], Dividers -> All]
enter image description here

$\endgroup$
4
  • $\begingroup$ EXTREMELY interesting - I've never seen this "TemporalData" mentioned anywhere in SE or elsewhere before. $\endgroup$
    – eldo
    Commented May 24, 2014 at 18:47
  • $\begingroup$ @eldo, there is this recent Q/A where i used TemporalData, and few others that come up when I search this site. $\endgroup$
    – kglr
    Commented May 24, 2014 at 18:59
  • $\begingroup$ The problem with TemporalData in my special case is that it fills out ALL consecutive missing points. To get a clear picture you really have to color them red like you did. With multiple sets I get a very colorfull, distracting image. On the other hand, I discovered countless other features of TemporalData which I can use in the future. So, many many thanks for your +1 presentation :) $\endgroup$
    – eldo
    Commented May 25, 2014 at 15:12
  • $\begingroup$ @eldo, my pleasure. $\endgroup$
    – kglr
    Commented May 25, 2014 at 15:16
4
$\begingroup$

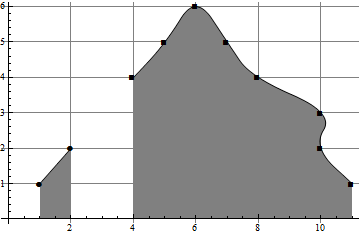
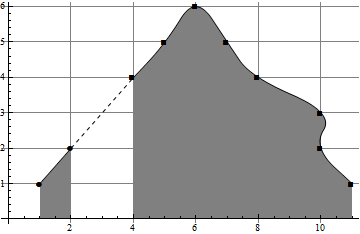
I gathered from some of the comments it might be desirable to retain the gap in the figure:

 data = {{1, 1}, {2, 2}, {3, 3}, {4, 4}, {5, 5}, {6, 6}, {7, 5},
           {8, 4}, {10, 3}, {10, 2}, {11, 1}}
 data[[3]] = {3, Missing[]}
 ListLinePlot[
     Select[ Split[data, Head[#1[[2]]] == Head[#2[[2]]] &] ,
          ( NumberQ[#[[1, 2]]]) &], 
 Filling -> Axis, FillingStyle -> GrayLevel[.5], 
     GridLines -> Automatic, Joined -> True, Mesh -> Full, 
     PlotMarkers -> Automatic, InterpolationOrder -> 2, 
     PlotStyle -> Black]

enter image description here

 ListLinePlot[
    s = Select[ 
        Split[data, 
        Head[#1[[2]]] == Head[#2[[2]]] &] , ( NumberQ[#[[1, 2]]]) &], 
        Filling -> Axis, FillingStyle -> GrayLevel[.5], 
        GridLines -> Automatic, Joined -> True, Mesh -> Full, 
        PlotMarkers -> Automatic, InterpolationOrder -> 2, 
        PlotStyle -> Black, 
        Epilog -> {Dashed, 
           Line[{#[[1, -1]], #[[2, 1]]}] & /@ Partition[s, 2, 1]}]

enter image description here

ps. use eg. FillingStyle -> Directive[Opacity[.25], Blue] so the fill doesn't cover the grid.

$\endgroup$
1
  • $\begingroup$ using dashed lines is certainly a further improvement. Thank you very much. $\endgroup$
    – eldo
    Commented May 29, 2014 at 7:40
1
$\begingroup$

Fill in the missing values by interpolation. The following simple example does not handle all cases (e.g., consecutive missing values).

data = Sort[{{1, 1}, {2, 2}, {3, Missing[]},
    {4, 4}, {5, 5}, {6, 6}, {7, Missing[]},
    {8, 4}, {10, 3}, {10, 2}, {11, 1}}];
(* Sort to make sure data is ordered prior to interpolation *)

(data[[#]] = {data[[#, 1]],
       Interpolation[
         {data[[# - 1]], data[[# + 1]]}][data[[#, 1]]]}) & /@ 
   Flatten[Position[data, {_, Missing[]}]]; // Quiet

Note that ListLinePlot does not need to use Joined option

ListLinePlot[data,
 Filling -> Axis,
 GridLines -> Automatic,
 Mesh -> Full,
 PlotMarkers -> Automatic,
 InterpolationOrder -> 2]

If the data does not include repeated x values (e.g., {..., {10, 3}, {10, 2}, ...}), delete missing data, interpolate, and use Plot.

data = {{1, 1}, {2, 2}, {3, Missing[]},
   {4, 4}, {5, 5}, {6, 6}, {7, Missing[]},
   {8, 4}, {10, 3}, {11, 1}};

data = DeleteCases[data, {_, Missing[]}];

f = Interpolation[data, InterpolationOrder -> 2];

Plot[f[x],
 {x, Min[data[[All, 1]]], Max[data[[All, 1]]]},
 AxesOrigin -> {0, 0},
 Filling -> Axis,
 GridLines -> Automatic,
 Epilog -> {AbsolutePointSize[6], Point[data]}
 ]

Bob Hanlon

$\endgroup$
1
  • $\begingroup$ Thanks, your first proposal works fine with my data and delivers the same image as belisarius' solution using "Select". When I use your Plot[f[x]... the image is somehow distorted. $\endgroup$
    – eldo
    Commented May 24, 2014 at 14:48

Your Answer

By clicking “Post Your Answer”, you agree to our terms of service and acknowledge you have read our privacy policy.

Not the answer you're looking for? Browse other questions tagged or ask your own question.