0
$\begingroup$

I have used show and to illustrate three graphs:

a1 = Plot[{5/(x + 3)}, {x, 0.1, 3}, AxesOrigin -> {0, 0}, PlotStyle -> {Thickness[0.006], {Yellow, Dashing[None]}}, Ticks -> None];

a2 = Plot[{5/(x - 1)}, {x, 0, 3}, AxesOrigin -> {0, 0},Exclusions -> 3/(x - 1) == 0, PlotStyle -> {Thickness[0.006], {Orange, Dashing[None]}}, Ticks -> None];
a4 = Plot[{5/(x)}, {x, 0, 3}, Epilog -> {Text[Style["og", 25], Scaled[{0.6, 0.5}]], Epilog -> {Text[Style["oscilation", 25], Scaled[{0.6, 1}]]}}, AxesOrigin -> {0, 0}, PlotStyle -> {Thickness[0.006], {Red, Dashing[None]}}, Ticks -> None];
text = Graphics[{Text[Style["cad", Large, Bold, Orange], Automatic, {2, -7}]}];
text1 = Graphics[{Text[Style["rof", Large, Bold, Green], Automatic, {4, 10}]}];
Show[a3, a1, a4, a2, text, text1, Axes -> True, AxesLabel -> {c, r}, LabelStyle -> Directive[Large, Black]]

I need a nice legend which shows different functions plotted in the graph. Could anyone help me?

$\endgroup$
2
  • $\begingroup$ What do you want to achieve? Seams you have taken some a high road to plot those functions. You could do it all in one plot. Nevertheless, you can use Legended to wrap around Show. $\endgroup$
    – ercegovac
    Commented Sep 28, 2017 at 18:25
  • $\begingroup$ I need a legend which shows different colors and descriptions next to each color. I'm new in using Mathematica and so I don't know what to do. Could you please help me? @ercegovac $\endgroup$ Commented Sep 28, 2017 at 18:28

2 Answers 2

1
$\begingroup$

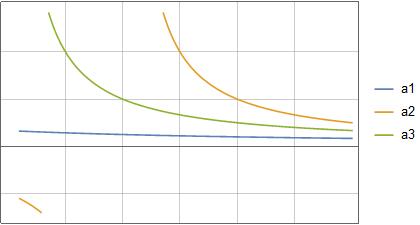
Does this solve your problem? If not, you will have to clarify your question.

Plot[{5/(x + 3), 5/(x - 1), 5/x}, {x, 0.1, 3}, AxesOrigin -> {0, 0}, 
 Ticks -> None, PlotLegends -> {"a1", "a2", "a3"}, 
 GridLines -> Automatic]

enter image description here

$\endgroup$
3
  • $\begingroup$ I don't need negative values of y axis. How can I remove them? Also, is it possible to remove the vertical orange line? $\endgroup$ Commented Sep 28, 2017 at 18:35
  • $\begingroup$ Well, add PlotRange -> {Automatic, {0, 10}}. You should definitely read help on Plot as well as some beginners tutorials on MMA before posting a question here. You will find Mathematica help quite extensive. Also there are plenty of resources on this website which will help you get started. $\endgroup$
    – ercegovac
    Commented Sep 28, 2017 at 18:39
  • $\begingroup$ Check out this thread on this website also. It will help you kick start with MMA. $\endgroup$
    – ercegovac
    Commented Sep 28, 2017 at 18:42
0
$\begingroup$

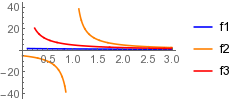
You can always create separate legends.

a1 = Plot[{5/(x + 3)}, {x, 0.1, 3}, AxesOrigin -> {0, 0}, 
     PlotStyle -> {Blue}, Ticks -> Automatic]

a2 = Plot[{5/(x - 1)}, {x, 0, 3}, AxesOrigin -> {0, 0}, 
     Exclusions -> 3/(x - 1) == 0, PlotStyle -> {Orange}, Ticks -> Automatic]

a4 = Plot[{5/(x)}, {x, 0, 3}, 
     AxesOrigin -> {0, 0}, PlotStyle -> {Red}, Ticks -> Automatic]

Grid[{{Show[a1, a2, a4, PlotRange -> {{0, 3.0}, {-40, 40}}], 
       LineLegend[{Blue, Orange, Red}, {"f1", "f2", "f3"}]}}]

enter image description here

$\endgroup$

Your Answer

By clicking “Post Your Answer”, you agree to our terms of service and acknowledge you have read our privacy policy.

Not the answer you're looking for? Browse other questions tagged or ask your own question.