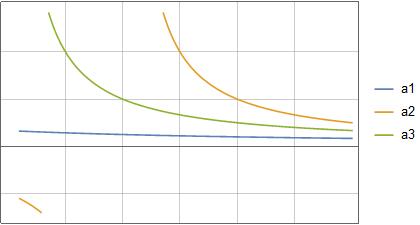
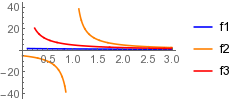
I have used show and to illustrate three graphs:
a1 = Plot[{5/(x + 3)}, {x, 0.1, 3}, AxesOrigin -> {0, 0}, PlotStyle -> {Thickness[0.006], {Yellow, Dashing[None]}}, Ticks -> None];

a2 = Plot[{5/(x - 1)}, {x, 0, 3}, AxesOrigin -> {0, 0},Exclusions -> 3/(x - 1) == 0, PlotStyle -> {Thickness[0.006], {Orange, Dashing[None]}}, Ticks -> None];
a4 = Plot[{5/(x)}, {x, 0, 3}, Epilog -> {Text[Style["og", 25], Scaled[{0.6, 0.5}]], Epilog -> {Text[Style["oscilation", 25], Scaled[{0.6, 1}]]}}, AxesOrigin -> {0, 0}, PlotStyle -> {Thickness[0.006], {Red, Dashing[None]}}, Ticks -> None];
text = Graphics[{Text[Style["cad", Large, Bold, Orange], Automatic, {2, -7}]}];
text1 = Graphics[{Text[Style["rof", Large, Bold, Green], Automatic, {4, 10}]}];
Show[a3, a1, a4, a2, text, text1, Axes -> True, AxesLabel -> {c, r}, LabelStyle -> Directive[Large, Black]]
I need a nice legend which shows different functions plotted in the graph. Could anyone help me?


Legendedto wrap aroundShow. $\endgroup$