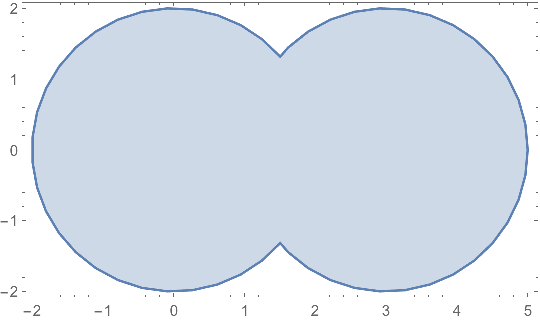
I usually look at my regions by plugging them into graphics:
Graphics[{Disk[{0, 0}, 2], Disk[{3, 0}, 2]}]
That works. But when I try to create the union of the regions, I can no longer visualize it (this fails):
Graphics[RegionUnion[Disk[{0, 0}, 2], Disk[{3, 0}, 2]]]
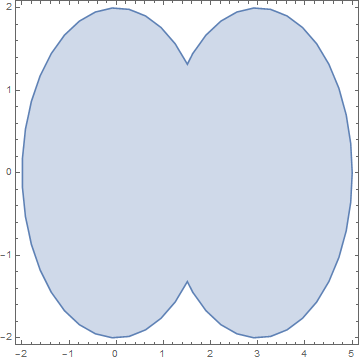
Why? And how can I visualize a region constructed through unions?
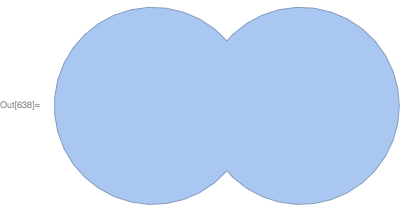
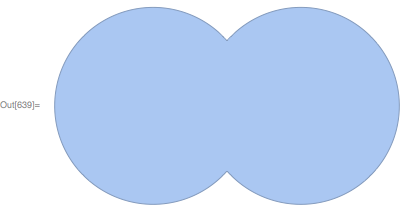
Incidentally, the documentation for RegionMember suggests that Region[RegionUnion[Disk[{0, 0}, 2], Disk[{3, 0}, 2]]] should generate an image. But it doesn't for me.


Regionwas introduced in V11.1. $\endgroup$