I was given the problem to find the area bounded by the polar curve
$$r=\frac{1}{2}+\frac{3}{2}\cos(\theta)$$
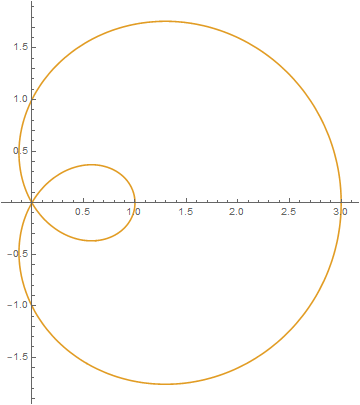
which looks like
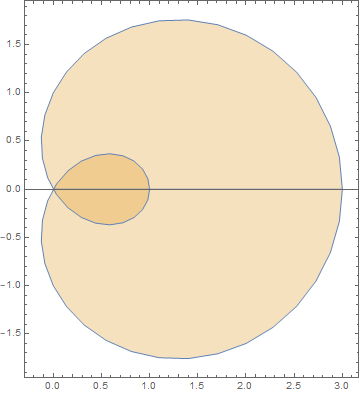
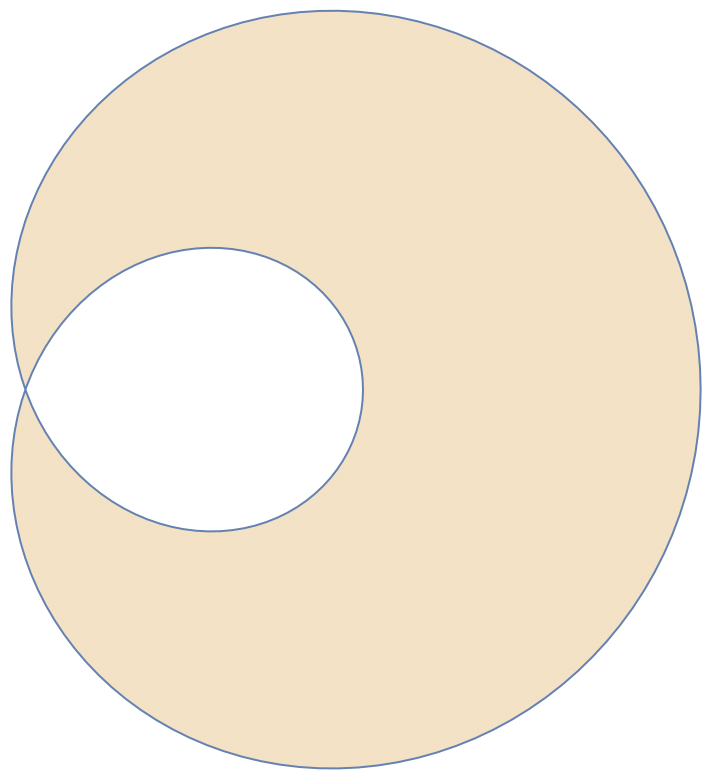
To be clear, the region meant is the lighter of the two here
I know the integrals needed to actually find the area, and that really isn't the question anymore. Instead, visualization is. I believe that can define the region that I am interested in with the code block (a and b were defined for generality)
a=1/2;
b=3/2;
v={(a c+b c Cos[t])Cos[t],(a c+b c Cos[t])Sin[t]};
R1=ParametricRegion[v,{{c,0,1},{t,0,(2\[Pi])/3}}];
R2=ParametricRegion[v,{{c,0,1},{t,2\[Pi])/3,(4\[Pi])/3}}];
R3=ParametricRegion[v,{{c,0,1},{t,(4\[Pi])/3,2\[Pi]}}];

R=RegionDifference[RegionUnion[R1,R3],R3];
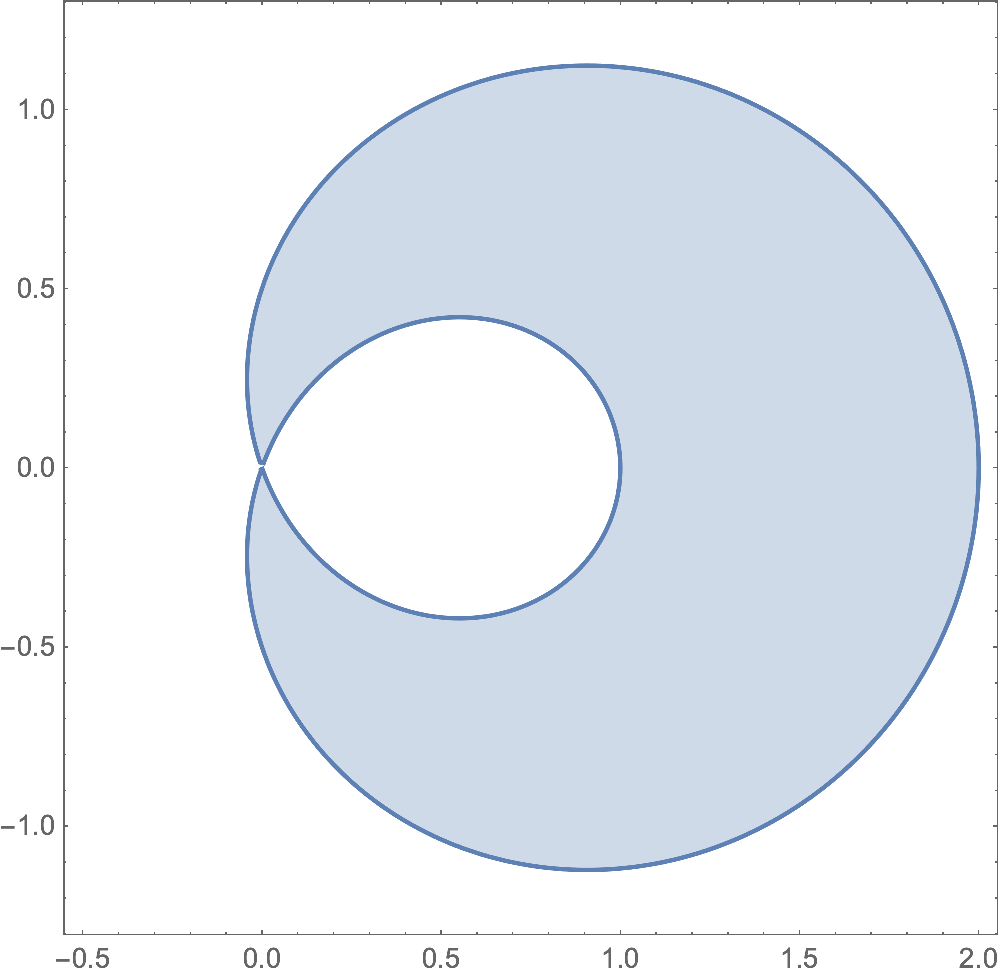
I can look at these individually, but when I use Region to visualize the whole thing, it doesn't return even a picture, just some internal expression. How can I visualize just the region of interest?


