4
$\begingroup$

I have been puzzled by the following issue:

When I am using LogLogPlot, while the graph of the function is transformed into the corresponding logarithmic expression, the values on the x and y axes remain the same. A good example is the following, taken from the documentation:

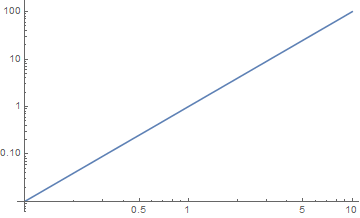
LogLogPlot[x^2, {x, 0.1, 10}]

enter image description here

When at x=10 the value of x^2 at $y$ axis should be, as correctly shown 100 but at a LogLogPlot, with Log[10,x] it should be: $\text{Log} (10^2)=2 \text{Log} 10=2$. Also, at x=10 the $x$ axis should be equivalently $\text{Log 10} =1$. But none of this is happening.

How is it possible to tell Mathematica to show the logarithmic values of the function and not the original ones?

$\endgroup$
6
  • 1
    $\begingroup$ do a regular plot of the log of the function. $\endgroup$
    – george2079
    Commented Jun 3, 2017 at 17:30
  • $\begingroup$ @george2079 Thank you for your comment. That solves the one part, I have thought of that. What about the $log$ value of the $x$ axes? $\endgroup$
    – Bazinga
    Commented Jun 3, 2017 at 17:32
  • 1
    $\begingroup$ It seems to you are confusing a LogLogPlot of x^2 with a Plot of LogLog[10, x^2]. They ar different beasts, $\endgroup$
    – m_goldberg
    Commented Jun 3, 2017 at 17:42
  • $\begingroup$ @m_goldberg I am saying that to a LogLogPlot of a function produces the graph of the function with axes Log[f[x]] and Log[x]. This is written in the documentation. My question has to do with the values on the axes. They do not correspond to logarithmic scale. Do they? What is it that I am missing? $\endgroup$
    – Bazinga
    Commented Jun 3, 2017 at 21:47
  • $\begingroup$ Because as I said before, you are not plotting Log[x^2} -- you are plotting x^2, with the plot scaled by the Log function. $\endgroup$
    – m_goldberg
    Commented Jun 4, 2017 at 1:52

1 Answer 1

4
$\begingroup$

A couple of ways:

Log-parametric plot:

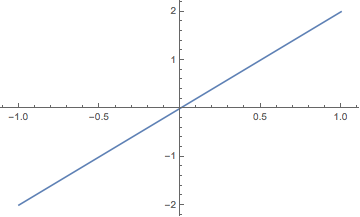
ParametricPlot[Log10@{x, x^2}, {x, 0.1, 10}, AspectRatio -> 0.6]

Mathematica graphics

Redefining the ticks (note that LogLogPlot transforms the coordinates by the natural logarithm, so the ticks have to be scaled by Log[10] to get common logarithm coordinate markings):

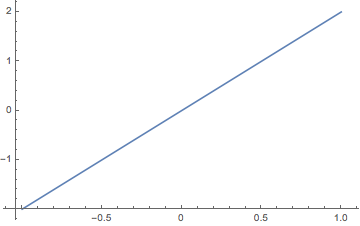
Show[LogLogPlot[x^2, {x, 0.1, 10}], 
 Ticks -> {Charting`ScaledTicks[{#*Log[10] &, #/Log[10] &}], 
   Charting`ScaledTicks[{#*Log[10] &, #/Log[10] &}]}, 
 PlotRangePadding -> Scaled[.05] (*OR*) (*AxesOrigin -> {Log[0.1],Log[0.01]}*)]

Mathematica graphics

Instead of PlotRangePadding (no vertical axis in V11.1.1 if omitted), one can also control the axes with AxesOrigin.

$\endgroup$
4
  • $\begingroup$ Thank you for the reply, the second option works for me. I noticed that if I use Frame->True, I lose the value transformation. Is there a workaround? $\endgroup$
    – Bazinga
    Commented Jun 3, 2017 at 17:58
  • $\begingroup$ Also, for some reason, in the function which I calculate (different from my example in the question), it seems have some values "cut-off" when I use your adjustment, even though the axis still looks as it should. It looks like I should play around with AxesOrigin $\endgroup$
    – Bazinga
    Commented Jun 3, 2017 at 18:14
  • $\begingroup$ @Mitscaype With Frame, you use FrameTicks instead of Ticks: FrameTicks -> {{Charting`ScaledTicks[{#*Log[10] &, #/Log[10] &}], Charting`ScaledFrameTicks[{#*Log[10] &, #/Log[10] &}]}, {Charting`ScaledTicks[{#*Log[10] &, #/Log[10] &}], Charting`ScaledFrameTicks[{#*Log[10] &, #/Log[10] &}]}} -- Not sure what to say about your second comment. M does sometimes reduce the PlotRange when set to Automatic, but you may be talking about some other sort of cut-off than I'm imagining. $\endgroup$
    – Michael E2
    Commented Jun 3, 2017 at 19:41
  • $\begingroup$ Thank you for taking the time to help me. I will try to figure out the reason of the cut-off, if not I will come back :) $\endgroup$
    – Bazinga
    Commented Jun 4, 2017 at 15:12

Your Answer

By clicking “Post Your Answer”, you agree to our terms of service and acknowledge you have read our privacy policy.

Not the answer you're looking for? Browse other questions tagged or ask your own question.