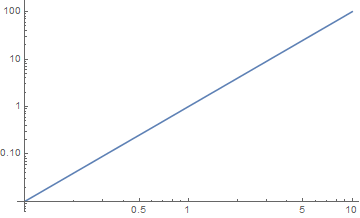
I have been puzzled by the following issue:
When I am using LogLogPlot, while the graph of the function is transformed into the corresponding logarithmic expression, the values on the x and y axes remain the same. A good example is the following, taken from the documentation:
LogLogPlot[x^2, {x, 0.1, 10}]
When at x=10 the value of x^2 at $y$ axis should be, as correctly shown 100 but at a LogLogPlot, with Log[10,x] it should be: $\text{Log} (10^2)=2 \text{Log} 10=2$. Also, at x=10 the $x$ axis should be equivalently $\text{Log 10} =1$. But none of this is happening.
How is it possible to tell Mathematica to show the logarithmic values of the function and not the original ones?

