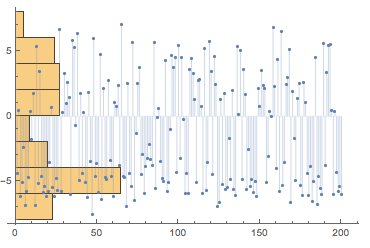
I have a time-dependent plot of points along the x-axis. These values will have a certain distribution when projected onto the y-axis. How can I plot a corresponding histogram of these values, based/started from the y-axis (i.e. a histogram tilted by 90 degrees)?
plotList={{592.5, -0.00043431},
ErrorBar[0.000278321]}}, {{{655., -0.000128374},
ErrorBar[0.000276677]}}, {{{696.5, 0.000016092},
ErrorBar[0.00029538]}}, {{{625., 0.0000796552},
ErrorBar[0.00028206]}}, {{{682., -0.000117011},
ErrorBar[0.000249439]}}, {{{719., -0.0000366048},
ErrorBar[0.000246761]}}, {{{917., -0.000133364},
ErrorBar[0.000321279]}}, {{{931.5, 0.0000925862},
ErrorBar[0.000232181]}}, {{{946., 0.000165025},
ErrorBar[0.000274432]}}, {{{860., 0.000122414},
ErrorBar[0.000313476]}}, {{{872., 0.0000972414},
ErrorBar[0.000251361]}}, {{{888., 0.0000806513},
ErrorBar[0.000278619]}}, {{{970., 0.0000185057},
ErrorBar[0.000288043]}}, {{{991., 0.000129885},
ErrorBar[0.000323213]}}, {{{1005.5, -0.0000224138},
ErrorBar[0.000297048]}}, {{{1046., 0.0000600726},
ErrorBar[0.000321164]}}, {{{1058.5, 0.000110739},
ErrorBar[0.000274034]}}, {{{1076., 0.000014751},
ErrorBar[0.000244478]}}, {{{1120., -0.0000457854},
ErrorBar[0.000316175]}}, {{{1132., 0.0000683744},
ErrorBar[0.000299614]}}, {{{1155., 0.0000898276},
ErrorBar[0.00024668]}}, {{{1205., 0.000136991},
ErrorBar[0.0003138]}}, {{{1218., 7.91075*10^-6},
ErrorBar[0.000296818]}}, {{{1234., 0.000140961},
ErrorBar[0.00027316]}}, {{{1276.5, 0.0000406897},
ErrorBar[0.000296665]}}, {{{1289., 0.000116878},
ErrorBar[0.0002688]}}, {{{1302., 0.000123765},
ErrorBar[0.000265536]}}, {{{1393., -0.0000846983},
ErrorBar[0.000274375]}}, {{{1404.5, 0.0000106985},
ErrorBar[0.000265274]}}, {{{1418., 0.000141379},
ErrorBar[0.00032606]}}, {{{768., -0.0000805911},
ErrorBar[0.000255396]}}, {{{783., 0.000107524},
ErrorBar[0.000264735]}}, {{{797.5, 0.000117845},
ErrorBar[0.000311275]}}

