I'd like to center the bars in my histograms over the correct values of the x-axis.
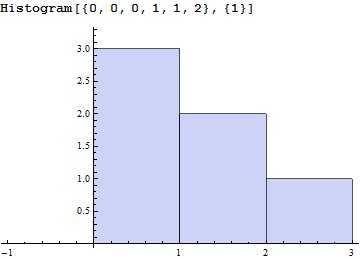
Here is a simplified example:

The most common value in the dataset is zero, but glancing at the histogram this isn't apparent. It might be zero, or it might be one. This histogram also makes one wonder if the number three appears in the dataset (and it doesn't).
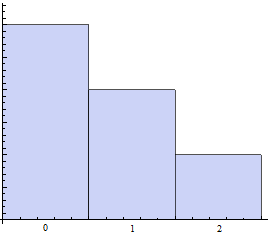
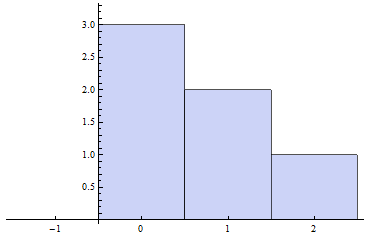
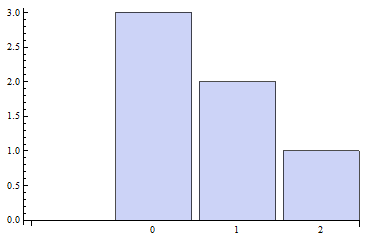
Here's a photoshop mockup of what I'd like (for the same dataset input)

Kind thanks in advance for any help.


