7
$\begingroup$

I know that neither of the two functions listed in the title exist, but I basically replaced vector for stream to give you an idea of what I want. The most ideal would be SliceStreamPlot3D, as the StreamPlot3D would be harder to visualize. Instead of seeing the magnitude of the vector at each location, I want to see the flow, i.e. a line with an arrow giving a direction like in StreamPlot.

I do not have a function to give you as the function I am using describes the magnetic field of a non ideal object, asy example takes up three pages (it is an analytical solution; therefore composed of well defined functions).

Instead, say I have the function f[y,-x,z], how can I show the StreamPlot say the $(x,y)$ plane at $z=0$ , another StreamPlot on the $y,z$ plane at $x=0$, and another StreamPlot on the $x,z$ plane at $y=0$?

For example I would like the following plot,

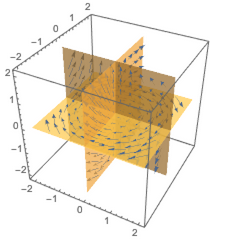
SliceVectorPlot3D[{y, -x, z}, "CenterPlanes", {x, -2, 2}, {y, -2, 2}, {z, -2, 2}]    

enter image description here

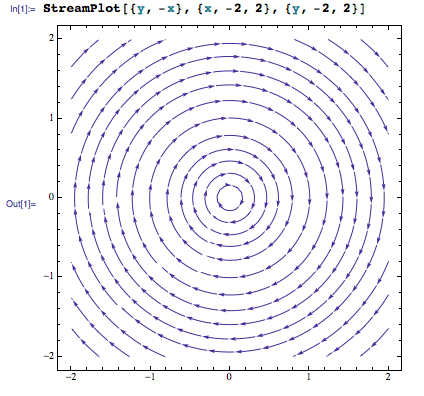
but a StreamPlot instead of a VectorPlot. Here are the StreamPlots that I would like to replace the VectorPlots in the SliceVectorPlot3D.

enter image description here

I can only put two pictures in (lack of reputation points), but you get what I'm wanting. The other two would be

StreamPlot[{-x, z}, {x, -2, 2}, {z, -2, 2}]    
StreamPlot[{y, z}, {y, -2, 2}, {z, -2, 2}]
$\endgroup$
4
  • $\begingroup$ "...the two functions...are real"? Real? What are you asking? $\endgroup$ Commented Feb 14, 2017 at 21:07
  • $\begingroup$ @David He means to say that he knows those two functions do not exist yet, but he would like help implementing them. Having said that, Josh, you need to provide something more to go on, I'm afraid. For instance, you don';t have to give us your function, but conjure up a simple example of application, and explain what you would like to see. Even better if you can make a mock-up of some kind. $\endgroup$
    – MarcoB
    Commented Feb 14, 2017 at 22:43
  • 1
    $\begingroup$ It does not make sense to have a SliceStreamPlot3D, because the streamlines of the vector field will not stay on the slice planes in general. $\endgroup$
    – user484
    Commented Feb 15, 2017 at 2:13
  • $\begingroup$ @Josh I had seen your comment that you deleted. It seems I defined f to take a list of coordinates while your version takes x, y, z as separate arguments. Just change your definition and it should work. $\endgroup$
    – halirutan
    Commented Feb 23, 2017 at 1:29

1 Answer 1

5
$\begingroup$

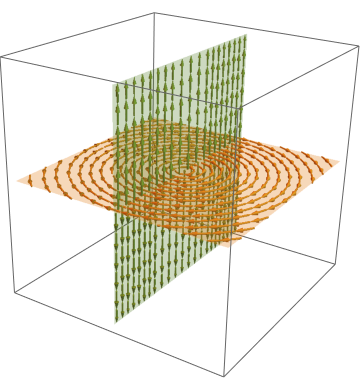
Obviously, my earlier first suggestion is exactly what SliceVectorPlot3D does, a function I was not aware of. Therefore, here is my suggestion how to convert 2d StreamPlots and transfer the arrows created into 3d space

gr1 = Graphics3D[(First@
     StreamPlot[f[{x, y, 0}][[;; 2]], {x, -3, 3}, {y, -3, 3}, 
      StreamStyle -> ColorData[97, 2]]) /. 
   Arrow[pts_] :> Arrow[Tube[Append[#, 0] & /@ pts]]];
gr2 = Graphics3D[(First@
     StreamPlot[f[{0, y, z}][[{2, 3}]], {y, -3, 3}, {z, -3, 3}, 
      StreamStyle -> ColorData[97, 3]]) /. 
   Arrow[pts_] :> Arrow[Tube[Prepend[#, 0] & /@ pts]]];

Show[gr1, gr2, 
 Graphics3D[{EdgeForm[None], 
   FaceForm[{Opacity[0.3], ColorData[97, 2]}],
   Polygon[{{-3, -3, 0}, {-3, 3, 0}, {3, 3, 0}, {3, -3, 0}}],
   FaceForm[{Opacity[0.3], ColorData[97, 3]}],
   Polygon[{{0, -3, -3}, {0, -3, 3}, {0, 3, 3}, {0, 3, -3}}]

   }]
 ]

Mathematica graphics

$\endgroup$
0

Your Answer

By clicking “Post Your Answer”, you agree to our terms of service and acknowledge you have read our privacy policy.

Not the answer you're looking for? Browse other questions tagged or ask your own question.