0
$\begingroup$

I am wanting to produce this shape, with a top at Y=1 and bottom at Y=-1. Shape
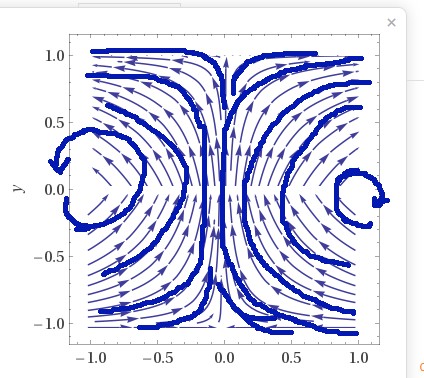
I have sort of sketched over it, but the stream shown is correct. I would like a vortex at each side at (-1,0) and (1,0) or maybe no vortex. How might I create the function for this in StreamPlot? Thank you very much.

$\endgroup$
2
  • $\begingroup$ Could you possibly give the code you used to generate the StreamPlot you have so far? Thanks! $\endgroup$
    – Anne
    Commented Nov 17, 2017 at 21:46
  • $\begingroup$ Hi Anne. I generated it in Wolfram Alpha with StreamPlot[{y,x},{x, -1, 1},{y, -1, 1}] and used Paint Shop to edit it (pasting it together). $\endgroup$ Commented Nov 18, 2017 at 0:17

1 Answer 1

1
$\begingroup$
StreamScale->Full

as in

StreamPlot[{-1 - x^2 + y, 1 + x - y^2}, 
 {x, -3, 3}, {y, -3, 3},
 StreamScale -> Full]
$\endgroup$
3
  • $\begingroup$ Thanks, you all are awesome. I'm trying to plot it in Wolfram Alpha as that's all I have at this moment, and I am getting something completely different, full of noise. Is there a reason why it's not plotting the same? StreamPlot[{-1 - x^2 + y, 1 + x - y^2}, {x, -3, 3}, {y, -3, 3}] i.imgur.com/Eyr17sY.jpg $\endgroup$ Commented Nov 18, 2017 at 0:13
  • $\begingroup$ I get exactly the same in Mathematica and WolframAlpha. $\endgroup$ Commented Nov 18, 2017 at 0:28
  • $\begingroup$ @rolypolyman Note that questions about Wolfram Alpha are explicitly off topic. $\endgroup$
    – Michael E2
    Commented Dec 18, 2017 at 2:53

Your Answer

By clicking “Post Your Answer”, you agree to our terms of service and acknowledge you have read our privacy policy.

Not the answer you're looking for? Browse other questions tagged or ask your own question.