deleted 12 characters in body
Source Link
Jason B.
  • 70.2k
  • 3
  • 144
  • 298

I know that neither of the two functions listed in the title do not exist, but I basically replaced vector for stream to give you an idea of what I want (the. The most ideal being awould be SliceStreamPlot3D, as the StreamPlot3D would be pretty hardharder to visualize). Instead of seeing the magnitude of the vector at each location, I want to see the flow, i.e. a line with an arrow giving a direction (like thelike in StreamPlot).

I do not have a function to give you as the function I am using describes the magnetic field of a non ideal object and, asy example takes up three pages (it is an analytical solution; therefore composed of well defined functions).

Instead, say I have the function f[y,-x,z], how can I show the StreamPlot say the $(x,y)$ plane at $z=0$ , another StreamPlot on the $y,z$ plane at $x=0$, and another StreamPlot on the $x,z$ plane at $y=0$?

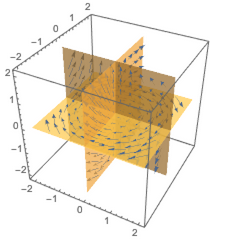
For example I would like the following plot,

SliceVectorPlot3D[{y, -x, z}, "CenterPlanes", {x, -2, 2}, {y, -2, 2}, {z, -2, 2}]    

enter image description here

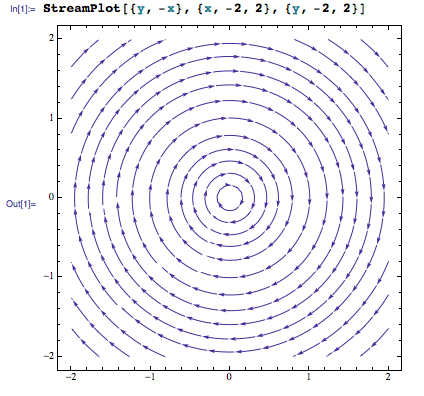
but a StreamPlot instead of a VectorPlot. Here are the StreamPlots that I would like to replace the VectorPlots in the SliceVectorPlot3D.

enter image description here

Sorry, I can only put two pictures in (lack of reputation points), but you get what I'm wanting. The other two would be

StreamPlot[{-x, z}, {x, -2, 2}, {z, -2, 2}]    
StreamPlot[{y, z}, {y, -2, 2}, {z, -2, 2}]

I know that neither of the two functions listed in the title do not exist, but I basically replaced vector for stream to give you an idea of what I want (the most ideal being a SliceStreamPlot3D as the StreamPlot3D would be pretty hard to visualize). Instead of seeing the magnitude of the vector at each location, I want to see the flow, i.e. a line with an arrow giving a direction (like the StreamPlot).

I do not have a function to give you as the function I am using describes the magnetic field of a non ideal object and takes up three pages (it is an analytical solution; therefore composed of well defined functions).

Instead, say I have the function f[y,-x,z], how can I show the StreamPlot say the $(x,y)$ plane at $z=0$ , another StreamPlot on the $y,z$ plane at $x=0$, and another StreamPlot on the $x,z$ plane at $y=0$?

For example I would like the following plot,

SliceVectorPlot3D[{y, -x, z}, "CenterPlanes", {x, -2, 2}, {y, -2, 2}, {z, -2, 2}]    

enter image description here

but a StreamPlot instead of a VectorPlot. Here are the StreamPlots that I would like to replace the VectorPlots in the SliceVectorPlot3D.

enter image description here

Sorry, I can only put two pictures in (lack of reputation points), but you get what I'm wanting. The other two would be

StreamPlot[{-x, z}, {x, -2, 2}, {z, -2, 2}]    
StreamPlot[{y, z}, {y, -2, 2}, {z, -2, 2}]
I know that neither of the two functions listed in the title exist, but I basically replaced vector for stream to give you an idea of what I want. The most ideal would be SliceStreamPlot3D, as the StreamPlot3D would be harder to visualize. Instead of seeing the magnitude of the vector at each location, I want to see the flow, i.e. a line with an arrow giving a direction like in StreamPlot.

I do not have a function to give you as the function I am using describes the magnetic field of a non ideal object, asy example takes up three pages (it is an analytical solution; therefore composed of well defined functions).

Instead, say I have the function f[y,-x,z], how can I show the StreamPlot say the $(x,y)$ plane at $z=0$ , another StreamPlot on the $y,z$ plane at $x=0$, and another StreamPlot on the $x,z$ plane at $y=0$?

For example I would like the following plot,

SliceVectorPlot3D[{y, -x, z}, "CenterPlanes", {x, -2, 2}, {y, -2, 2}, {z, -2, 2}]    

enter image description here

but a StreamPlot instead of a VectorPlot. Here are the StreamPlots that I would like to replace the VectorPlots in the SliceVectorPlot3D.

enter image description here

I can only put two pictures in (lack of reputation points), but you get what I'm wanting. The other two would be

StreamPlot[{-x, z}, {x, -2, 2}, {z, -2, 2}]    
StreamPlot[{y, z}, {y, -2, 2}, {z, -2, 2}]
added 763 characters in body
Source Link
Josh
  • 545
  • 2
  • 14

I know that neither of the two functions listed above are realin the title do not exist, but I basically replaced vector for stream to give you an idea of what I want (the most ideal being a SliceStreamPlot3D as the StreamPlot3D would be pretty hard to visualize). Instead of seeing the magnitude of the vector at each location, I want to see the flow, i.e. a line with an arrow giving a direction (like the StreamPlot).

I do not have a function to give you as the function I am using describes the magnetic field of a non ideal object and takes up three pages (it is an analytical solution; therefore composed of well defined functions).

Instead, say I have the function f[y,-x,z], how can I show the StreamPlot say the $(x,y)$ plane at $z=0$ and, another StreamPlot on the $y,z$ plane at $x=0$, and another StreamPlot on the $x,z$ plane at $y=0$?

For example I would like the following plot,

SliceVectorPlot3D[{y, -x, z}, "CenterPlanes", {x, -2, 2}, {y, -2, 2}, {z, -2, 2}]    

enter image description here

but a StreamPlot instead of a VectorPlot. Here are the StreamPlots that I would like to replace the VectorPlots in the SliceVectorPlot3D.

enter image description here

Sorry, I can only put two pictures in (lack of reputation points), but you get what I'm wanting. The other two would be

StreamPlot[{-x, z}, {x, -2, 2}, {z, -2, 2}]    
StreamPlot[{y, z}, {y, -2, 2}, {z, -2, 2}]

I know that neither of the two functions listed above are real, but I basically replaced vector for stream to give you an idea of what I want (the most ideal being a SliceStreamPlot3D as the StreamPlot3D would be pretty hard to visualize). Instead of seeing the magnitude of the vector at each location, I want to see the flow, i.e. a line with an arrow giving a direction (like the StreamPlot).

I do not have a function to give you as the function I am using describes the magnetic field of a non ideal object and takes up three pages (it is an analytical solution; therefore composed of well defined functions).

Instead, say I have the function f[y,-x,z], how can I show the StreamPlot say the $(x,y)$ plane at $z=0$ and another StreamPlot on the $y,z$ plane at $x=0$?

I know that neither of the two functions listed in the title do not exist, but I basically replaced vector for stream to give you an idea of what I want (the most ideal being a SliceStreamPlot3D as the StreamPlot3D would be pretty hard to visualize). Instead of seeing the magnitude of the vector at each location, I want to see the flow, i.e. a line with an arrow giving a direction (like the StreamPlot).

I do not have a function to give you as the function I am using describes the magnetic field of a non ideal object and takes up three pages (it is an analytical solution; therefore composed of well defined functions).

Instead, say I have the function f[y,-x,z], how can I show the StreamPlot say the $(x,y)$ plane at $z=0$ , another StreamPlot on the $y,z$ plane at $x=0$, and another StreamPlot on the $x,z$ plane at $y=0$?

For example I would like the following plot,

SliceVectorPlot3D[{y, -x, z}, "CenterPlanes", {x, -2, 2}, {y, -2, 2}, {z, -2, 2}]    

enter image description here

but a StreamPlot instead of a VectorPlot. Here are the StreamPlots that I would like to replace the VectorPlots in the SliceVectorPlot3D.

enter image description here

Sorry, I can only put two pictures in (lack of reputation points), but you get what I'm wanting. The other two would be

StreamPlot[{-x, z}, {x, -2, 2}, {z, -2, 2}]    
StreamPlot[{y, z}, {y, -2, 2}, {z, -2, 2}]
Formatted code
Source Link
MarcoB
  • 67.7k
  • 18
  • 96
  • 198

I know that neither of the two functions listed above are real, but I basically replaced vector for stream to give you an idea of what I want (the most ideal being a SliceStreamPlot3DSliceStreamPlot3D as the StreamPlot3DStreamPlot3D would be pretty hard to visualize). InsteadInstead of seeing the magnitude of the vector at each location, I want to see the flow, i.e. a line with an arrow giving a direction (like the StreamPlotStreamPlot). I

I do not have a function to give you as the function I am using describes the magnetic field of a non ideal object and takes up three pages (it is an analytical solution; therefore composed of well defined functions).

Instead, say I have the function f{y,-x,z}f[y,-x,z], how can I show the StreamPlotStreamPlot say the x,y$(x,y)$ plane at z=0$z=0$ and another StreamPlotStreamPlot on the y,z$y,z$ plane at x=0$x=0$?

I know that neither of the two functions listed above are real, but I basically replaced vector for stream to give you an idea of what I want (the most ideal being a SliceStreamPlot3D as the StreamPlot3D would be pretty hard to visualize). Instead of seeing the magnitude of the vector at each location, I want to see the flow, i.e. a line with an arrow giving a direction (like the StreamPlot). I do not have a function to give you as the function I am using describes the magnetic field of a non ideal object and takes up three pages (it is an analytical solution; therefore composed of well defined functions).

Instead, say I have the function f{y,-x,z}, how can I show the StreamPlot say the x,y plane at z=0 and another StreamPlot on the y,z plane at x=0?

I know that neither of the two functions listed above are real, but I basically replaced vector for stream to give you an idea of what I want (the most ideal being a SliceStreamPlot3D as the StreamPlot3D would be pretty hard to visualize). Instead of seeing the magnitude of the vector at each location, I want to see the flow, i.e. a line with an arrow giving a direction (like the StreamPlot).

I do not have a function to give you as the function I am using describes the magnetic field of a non ideal object and takes up three pages (it is an analytical solution; therefore composed of well defined functions).

Instead, say I have the function f[y,-x,z], how can I show the StreamPlot say the $(x,y)$ plane at $z=0$ and another StreamPlot on the $y,z$ plane at $x=0$?

Source Link
Josh
  • 545
  • 2
  • 14
Loading