15
$\begingroup$

I was trying to integrate a continuous function with a kink and I did it two ways and both ways the plot of the result shows a discontinuity. I also later want to differentiate the Integrated function.

a=5;
DSolve[Y'[H] == Max[H, a], Y[H], H]
{{Y[H] -> C[1] + 1/2 (2 a H + (a - H)^2 UnitStep[-a + H])}}

or alternatively

Integrate[Max[H, a], H]

I get

$ \begin{array}{ll} \Big\{ & \begin{array}{ll} 5 H & H\leq 5 \\ \frac{25}{2}+\frac{H^2}{2} & \text{True} \end{array} \end{array} $

When I plot the output from the ODE or Plot what I get from the result of the Integration command, I get the same plot, of course, but with this discontinuity at $a$.

Plot[1/2 (2 a H + (a - H)^2 UnitStep[-a + H]), {H, 4.9, 5.1}]

I get:
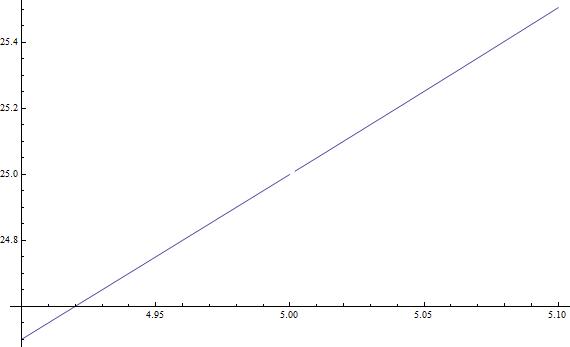
Plot with discontinuity

Why is this happening? If I do other operations with this function, is Mathematica gonna treat it as a continuous function or a discontinuous one? I can't remember my math right now but this new function should be differentiable also right since it was the result of an Integration?

When I do this:

 FullSimplify[D[1/2 (2 a H + (a - H)^2 UnitStep[-a + H]), H]]

I get:

$ \begin{array}{ll} \{ & \begin{array}{ll} 5 & H<5 \\ H & H>5 \\ \text{Indeterminate} & \text{True} \end{array} \end{array} $

Is the fact that I am getting this Indeterminate in the middle something to do with the discontinuity?

$\endgroup$
6
  • $\begingroup$ Try e.g. Plot[1/2 (2 a H + (a - H)^2 UnitStep[-a + H]), {H, 4.9, 5.1}, PlotPoints -> 300] $\endgroup$
    – Artes
    Commented Oct 26, 2012 at 0:56
  • $\begingroup$ @Artes ok that worked. Thanks! Do you have a sense of why I am getting an Intermediate when I differentiate? $\endgroup$
    – Amatya
    Commented Oct 26, 2012 at 1:08
  • $\begingroup$ Try a simpler case, e.g. : D[ UnitStep[x], x], UnitStep is a discontinuous function at 0. $\endgroup$
    – Artes
    Commented Oct 26, 2012 at 1:14
  • $\begingroup$ @Artes but 1/2 (2 a x + (a - x)^2 UnitStep[-a + x]) is a continuous and even differentiable function whose derivative should be Max[x,a]. I guess MMA is not able to figure this out and I need to communicate it to MMA somehow. $\endgroup$
    – Amatya
    Commented Oct 26, 2012 at 1:31
  • 4
    $\begingroup$ The gap in the plot can also be removed using the option setting Exclusions->None. If you plot PiecewiseExpand[1/2 (2 a h + (a - h)^2 UnitStep[-a + h])] you also get the same gap at h=5 although D[PiecewiseExpand[1/2 (2 a h + (a - h)^2 UnitStep[-a + h])],h] does not have the Indeterminate piece; but Plot "sees" some discontinuity in both functions, and inreasing the setting for PlotPoints reduces the size of gap, and Exclusions->None removes it. (Mma V 8.04.0, Windows Vista 64bit) $\endgroup$
    – kglr
    Commented Oct 26, 2012 at 1:36

2 Answers 2

19
$\begingroup$

The solution is to use Exclusions->None as option to Plot.

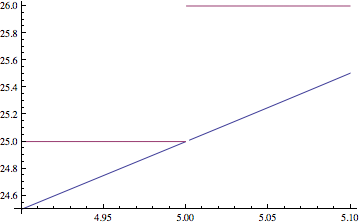
The gap happens exactly where UnitStep[-a+h] has its discontinuity

With[{a = 5}, 
  Plot[{1/2 (2 a H + (a - H)^2 UnitStep[-a + H]), 
    UnitStep[-a + H] + 25}, {H, 4.9, 5.1}]
 ]

Mathematica graphics

This behavior was introduced, when Wolfram decided, that discontinuities should be discontinuous displayed in Plot. When you look at the function, to see whether or not there is a crack, you should use Limit. Here you see, that the derivative is the same from both directions

With[{a = 5},
   Limit[D[1/2 (2 a H + (a - H)^2 UnitStep[-a + H]), H], H -> 5, 
    Direction -> #]
   ] & /@ {1, -1}  

(* {5, 5} *)

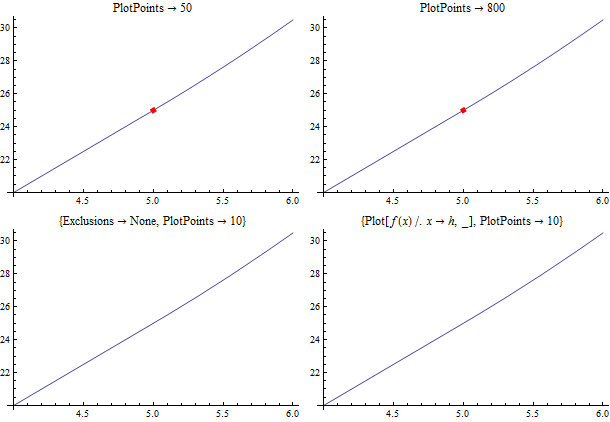
Therefore, it seems Plot internals work as if there is a discontinuity where there is none. The first two examples in the following suggest that forcing Plot to sample more points does not remove the "discontinuity". The third one (Exclusions->None) explicitly forces Plot to treat the line as continuous, and the last one (I think ... somehow) makes Plot internals "realize" that there are, in fact, no discontinuities in the first argument.

 Grid[{{Plot[1/2 (2 a h + (a - h)^2 UnitStep[-a + h]), {h, 4., 6},
        PlotPoints -> 50, ImageSize -> 300, 
        ExclusionsStyle -> Directive[AbsoluteThickness[5], Red],
        PlotLabel -> HoldForm[PlotPoints -> 50]],
   Plot[1/2 (2 a h + (a - h)^2 UnitStep[-a + h]), {h, 4., 6},
        PlotPoints -> 800, ImageSize -> 300, 
        ExclusionsStyle -> Directive[AbsoluteThickness[5], Red],
        PlotLabel -> HoldForm[PlotPoints -> 800]]},
  {Plot[1/2 (2 a h + (a - h)^2 UnitStep[-a + h]), {h, 4., 6},
       PlotPoints -> 10, ImageSize -> 300, Exclusions -> None,
       PlotLabel -> HoldForm[{Exclusions -> None, PlotPoints -> 10}]],
   Plot[1/2 (2 a hh + (a - hh)^2 UnitStep[-a + hh]) /. hh -> h, {h, 4., 6},
       PlotPoints -> 10, ImageSize -> 300, 
       ExclusionsStyle -> Directive[AbsoluteThickness[5], Red],
       PlotLabel -> HoldForm[{Plot[f[x] /. x -> h, _], PlotPoints -> 10}]]}}]

enter image description here

$\endgroup$
6
  • 1
    $\begingroup$ +1, it's not a comment ;-) Please review my additions. $\endgroup$
    – halirutan
    Commented Oct 26, 2012 at 8:57
  • $\begingroup$ @halirutan, very nice, thank you. $\endgroup$
    – kglr
    Commented Oct 26, 2012 at 13:32
  • $\begingroup$ @kguler Thank for for such an excellent explanation! I learnt about using limits in mathematica, especially inside a plot, as an additional bonus. :) It's interesting that you spotted that taking limits makes mathematica realize that the curve is continuous. cool beans! $\endgroup$
    – Amatya
    Commented Nov 4, 2012 at 20:46
  • $\begingroup$ @Amatya, thanks for the accept. $\endgroup$
    – kglr
    Commented Nov 4, 2012 at 23:29
  • 1
    $\begingroup$ I know this is quite old... but thanks! I think the last option about using ReplaceAll and replace the variable for another is much better than the ubiquitous solution of Exclusions -> None, just to have the flexibility of still be able to plot discontinuous functions properly. $\endgroup$
    – abcd
    Commented Aug 27, 2020 at 2:08
1
$\begingroup$

In newer versions (V11 or at least by V11.3), the gap shown at a point discontinuity is almost negligible, but present:

Plot[0.1 UnitStep[1/200 - a + H] + 
   1/2 (2 a H + (a - H)^2 UnitStep[-a + H]), {H, 4.9, 5.1}];
GraphicsRow[{%, Show[%, PlotRange -> {{4.995, 5.002}, Automatic}]}, ImageSize->Large]

enter image description here

Here's a general utility that removes exclusions that are continuities, but includes actual discontinuities (Exclusions -> None connects all segments, even the truly discontinuous ones):

ClearAll[includeContinuousSingularities];
SetAttributes[includeContinuousSingularities, HoldAll];
includeContinuousSingularities[tol_ /; NumericQ[tol]] := 
  Function[p, includeContinuousSingularities[p, tol], HoldAll];
includeContinuousSingularities[Plot[f_, {v_, a_, b_}, rest___], tol_: 1.*^-10] :=
 Module[{sing, disc},
  sing = Flatten@ Apply[And, DeleteCases[
    Simplify`FunctionSingularities[f, {v}, {"ALL", "IGNORE", "PWMINMAX"}], {}], {2}];
  sing = DeleteDuplicates@ Flatten@ Quiet@
       DeleteCases[NSolve[# && a < v < b, v] & /@ sing, _NSolve | {} | {{}}];
  disc = Equal @@@ Pick[sing,
     Chop[Block[{v = v /. #}, f] - Limit[f, #], tol] =!= 0 & /@ sing];
  Plot[f, {v, a, b}, rest, Exclusions -> disc]
  ]

Plot[
 0.1 UnitStep[1/200 - a + H] + 1/2 (2 a H + (a - H)^2 UnitStep[-a + H]),
 {H, 4.9, 5.1}] // includeContinuousSingularities;
GraphicsRow[{%, Show[%, PlotRange -> {{4.995, 5.002}, Automatic}]}, ImageSize->Large]

enter image description here

One could use Solve instead of NSolve, but NSolve over a bounded interval is pretty robust. One might also put a time constraint (TimeConstrained) on NSolve. With numerical methods, one has to be careful of comparing results; hence, I used Chop. The tolerance parameter tol is probably unnecessary, unless the function values are really small. See also Plot a piecewise function with black and white disks marking discontinuities.

$\endgroup$

Your Answer

By clicking “Post Your Answer”, you agree to our terms of service and acknowledge you have read our privacy policy.

Not the answer you're looking for? Browse other questions tagged or ask your own question.