added 66 characters in body
Source Link
halirutan
  • 113.4k
  • 7
  • 266
  • 479

The solution is to use Exclusions->None as option to Plot.

The gap happens exactly where UnitStep[-a+h] has its discontinuity

The gap happens exactly where UnitStep[-a+h] has its discontinuity

The solution is to use Exclusions->None as option to Plot.

The gap happens exactly where UnitStep[-a+h] has its discontinuity

Added some information
Source Link
halirutan
  • 113.4k
  • 7
  • 266
  • 479

A comment too long for the comment box:The gap happens exactly where UnitStep[-a+h] has its discontinuity

With[{a = 5}, 
  Plot[{1/2 (2 a H + (a - H)^2 UnitStep[-a + H]), 
    UnitStep[-a + H] + 25}, {H, 4.9, 5.1}]
 ]

Mathematica graphics

The issue seems toThis behavior was introduced, when Wolfram decided, that discontinuities should be related to the way exclusions are handled bydiscontinuous displayed in Plot. ApparentlyWhen you look at the function, to see whether or not there is a crack, you should use Limit. Here you see, that the derivative is the same from both directions

With[{a = 5},
   Limit[D[1/2 (2 a H + (a - H)^2 UnitStep[-a + H]), H], H -> 5, 
    Direction -> #]
   ] & /@ {1, -1}  

(* {5, 5} *)

Therefore, it seems Plot internals work as if there is a discontinuity where there is none. The first two examples in the following suggest that forcing Plot to sample more points does not remove the "discontinuity". The third one (Exclusions->None) explicitly forces Plot to treat the line as continuous, and the last one (I think ... somehow) makes Plot internals "realize" that there are, in fact, no discontinuities in the first argument.

A comment too long for the comment box:

The issue seems to be related to the way exclusions are handled by Plot. Apparently, Plot internals work as if there is a discontinuity where there is none. The first two examples in the following suggest that forcing Plot to sample more points does not remove the "discontinuity". The third one (Exclusions->None) explicitly forces Plot to treat the line as continuous, and the last one (I think ... somehow) makes Plot internals "realize" that there are, in fact, no discontinuities in the first argument.

The gap happens exactly where UnitStep[-a+h] has its discontinuity

With[{a = 5}, 
  Plot[{1/2 (2 a H + (a - H)^2 UnitStep[-a + H]), 
    UnitStep[-a + H] + 25}, {H, 4.9, 5.1}]
 ]

Mathematica graphics

This behavior was introduced, when Wolfram decided, that discontinuities should be discontinuous displayed in Plot. When you look at the function, to see whether or not there is a crack, you should use Limit. Here you see, that the derivative is the same from both directions

With[{a = 5},
   Limit[D[1/2 (2 a H + (a - H)^2 UnitStep[-a + H]), H], H -> 5, 
    Direction -> #]
   ] & /@ {1, -1}  

(* {5, 5} *)

Therefore, it seems Plot internals work as if there is a discontinuity where there is none. The first two examples in the following suggest that forcing Plot to sample more points does not remove the "discontinuity". The third one (Exclusions->None) explicitly forces Plot to treat the line as continuous, and the last one (I think ... somehow) makes Plot internals "realize" that there are, in fact, no discontinuities in the first argument.

Source Link
kglr
  • 400.5k
  • 18
  • 488
  • 929

A comment too long for the comment box:

The issue seems to be related to the way exclusions are handled by Plot. Apparently, Plot internals work as if there is a discontinuity where there is none. The first two examples in the following suggest that forcing Plot to sample more points does not remove the "discontinuity". The third one (Exclusions->None) explicitly forces Plot to treat the line as continuous, and the last one (I think ... somehow) makes Plot internals "realize" that there are, in fact, no discontinuities in the first argument.

 Grid[{{Plot[1/2 (2 a h + (a - h)^2 UnitStep[-a + h]), {h, 4., 6},
        PlotPoints -> 50, ImageSize -> 300, 
        ExclusionsStyle -> Directive[AbsoluteThickness[5], Red],
        PlotLabel -> HoldForm[PlotPoints -> 50]],
   Plot[1/2 (2 a h + (a - h)^2 UnitStep[-a + h]), {h, 4., 6},
        PlotPoints -> 800, ImageSize -> 300, 
        ExclusionsStyle -> Directive[AbsoluteThickness[5], Red],
        PlotLabel -> HoldForm[PlotPoints -> 800]]},
  {Plot[1/2 (2 a h + (a - h)^2 UnitStep[-a + h]), {h, 4., 6},
       PlotPoints -> 10, ImageSize -> 300, Exclusions -> None,
       PlotLabel -> HoldForm[{Exclusions -> None, PlotPoints -> 10}]],
   Plot[1/2 (2 a hh + (a - hh)^2 UnitStep[-a + hh]) /. hh -> h, {h, 4., 6},
       PlotPoints -> 10, ImageSize -> 300, 
       ExclusionsStyle -> Directive[AbsoluteThickness[5], Red],
       PlotLabel -> HoldForm[{Plot[f[x] /. x -> h, _], PlotPoints -> 10}]]}}]
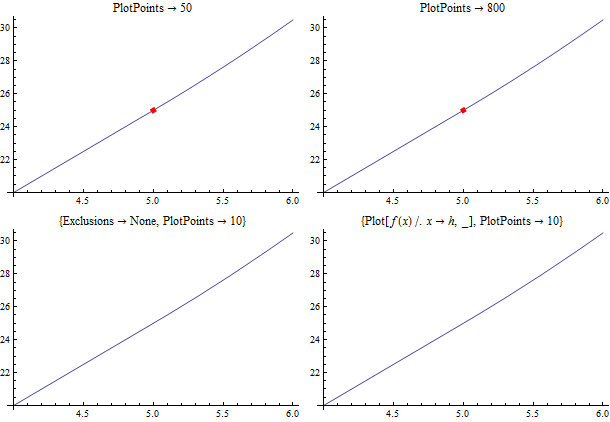
enter image description here