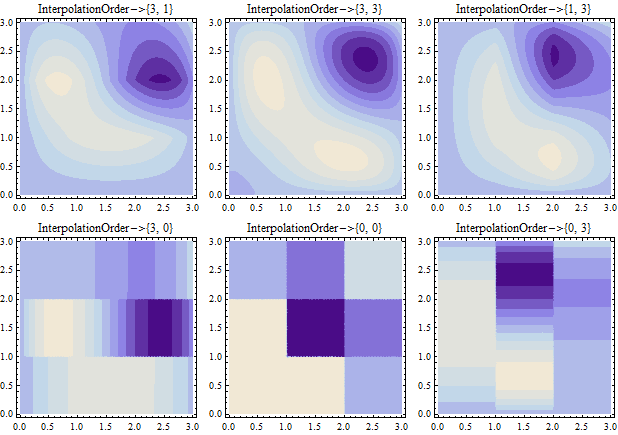
I am using ListDensityPlot to plot a set of graphs, i.e. I have got a rectangular grid. Is there any way how to prevent interpolation along the y axis and interpolate data only in the x direction? So far I was thinking only about "pre-interpolation" of my dataset before I plot it and then using InterpolationOrder->0.
$\begingroup$
$\endgroup$
0
Add a comment
|
1 Answer
$\begingroup$
$\endgroup$
Perhaps,
data = Table[Sin[x y], {x, 0, 3, 1.}, {y, 0, 3, 1.}];

ContourPlot[ListInterpolation[data, {{0, 3}, {0, 3}},
      InterpolationOrder -> #][x, y], {x, 0, 3}, {y, 0, 3}, ContourStyle -> None,
  PlotLabel -> Row[{"InterpolationOrder->",#}], ImageSize -> 200] & /@
   {{3, 1}, {3,3}, {1, 3}, {3, 0}, {0,0}, {0, 3}} // Grid[Partition[#, 2]] &

