4
$\begingroup$

I have a set of data that is in the form

{{\[Theta], \[Phi], r},....}

Or to make it simpler:

data={{0, 0, 3.3102}, {0, 2, 3.3102}, ..., {10, 90, 4.084}}

Alternatively, a data set can be generated by using:

data=Flatten[Table[{th,phi,RandomReal[100]},{th,0,45,2},{phi,0,90,2}],1];

Now I want to plot this data in a polar plot to get something equivalent to: Polar Plot of ion ranges in Al foil
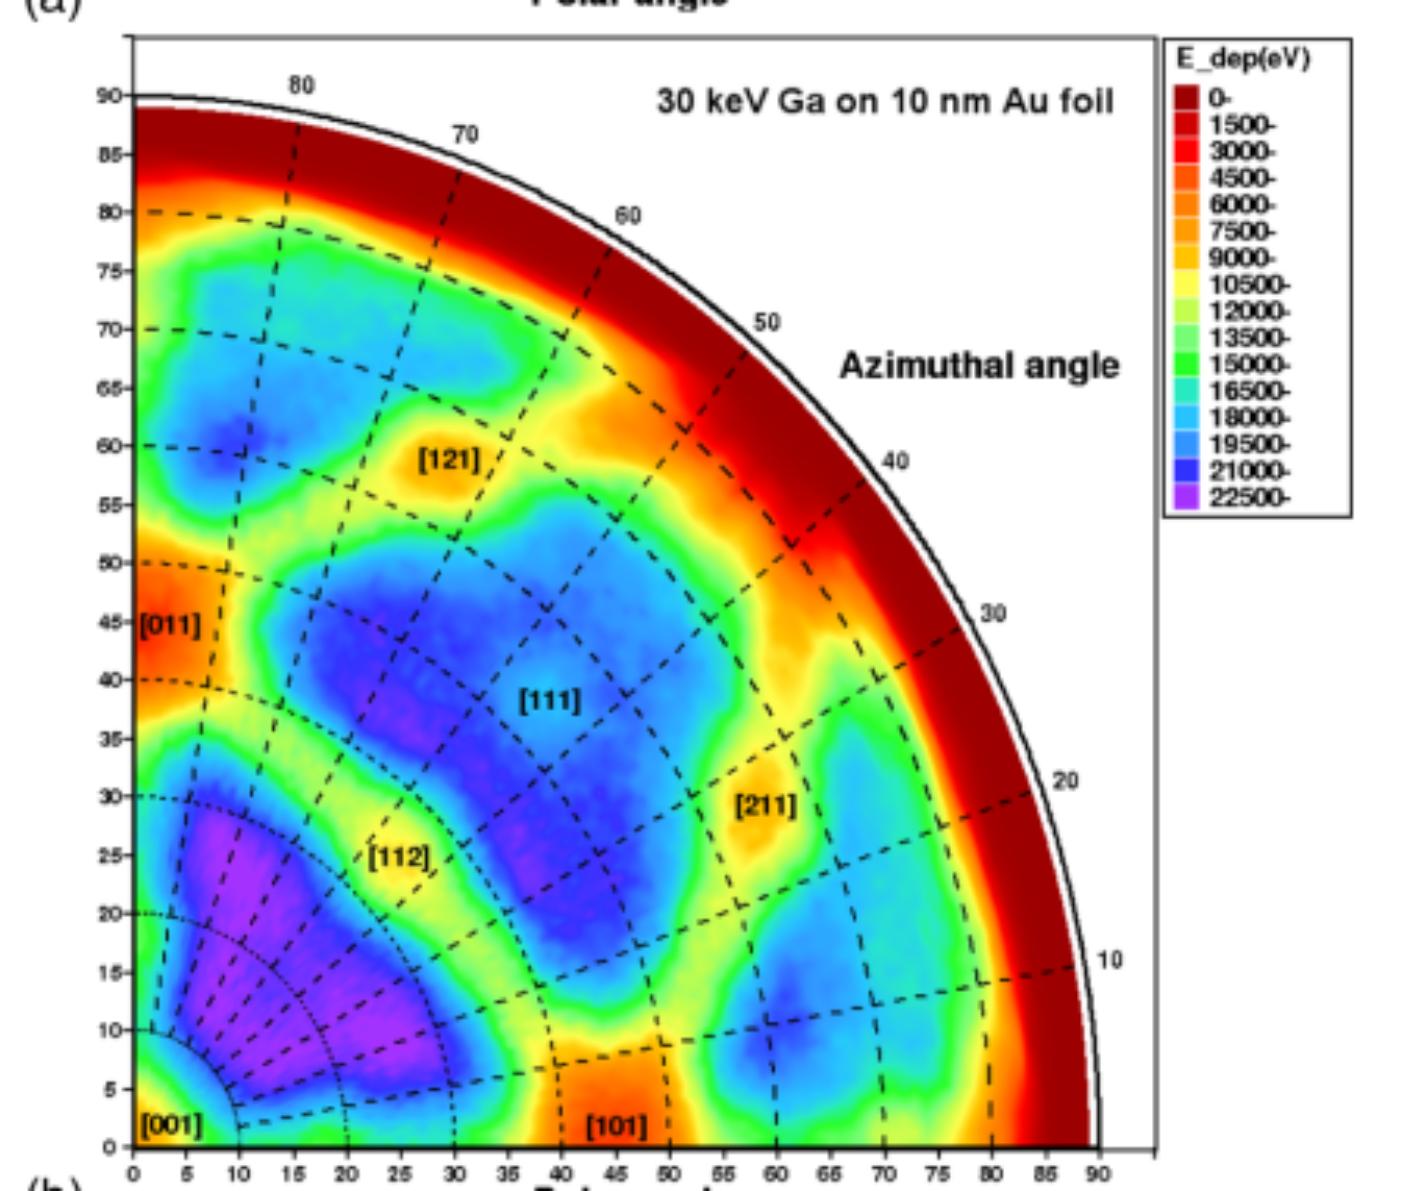
Where the text in the picture referring to different crystal planes is not important. To generate a uniform density plot, there should be some interpolation between data points but I guess that is not necessary as I can always do that in preprocessing of the data points. Now this is somewhat easily generated by using python, however I am looking for a way to generate such a plot in mathematica in attempts to keep layout consistency between my other plots.

I can easily generate a ListDensityPlot using:

ListDensityPlot[data]

That looks like (with some legends manipulation and graphics options tweaked to make it look "more presentable"): created by me
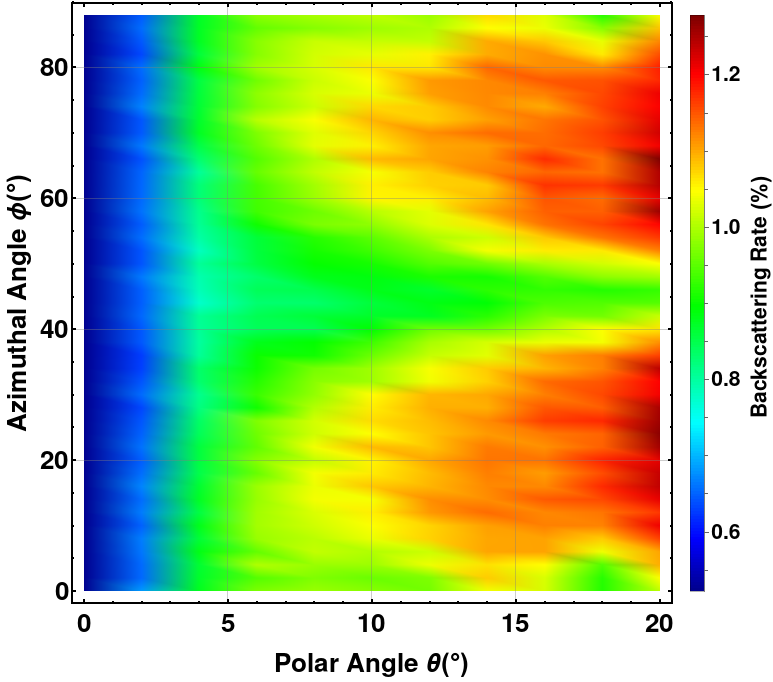
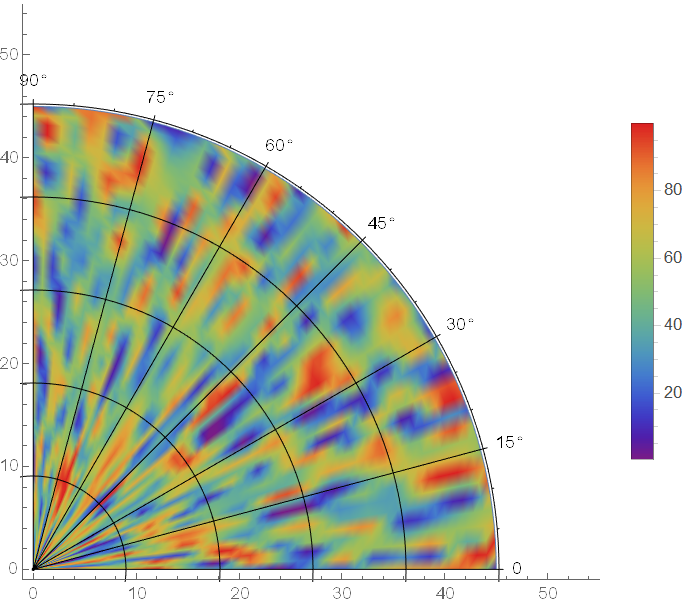
I managed to convert the rectangular plot to a circular one using transfromation of coordinates i.e.

N[{#[[1]] Cos[#[[2]]], #[[1]] Sin[#[[2]]], #[[3]]}] & /@data

Not a 100% sure that this is correct to be honest, but I guess it is the right approach i.e. convert coordinates

But I still don't know how to add the grid lines properly, the custom legend i.e. Azimuthal Angle I guess I can always add afterwards by hand but it would be appreciated to add it while plotting too

$\endgroup$
4
  • $\begingroup$ If your data is really in the form {θ, ϕ, r}, where θ is polar angle and ϕ is azimuthal angle, then I don't think this can be visualized with polar heat map. Please notice the coordinates in polar coordinate system are radius and azimuth. Perhaps you're looking for ListSliceDensityPlot3D. $\endgroup$
    – xzczd
    Commented Sep 30, 2020 at 2:31
  • $\begingroup$ In theory my data can vary, r is just a place holder for range in the material or transmission rate through a foil or whatever. Whereas theta and phi are indeed the polar and azimuthal angle respectively. Basically what I am looking for is having a plot the same as in the first figure, where theta is on the x and y axis, the azimuthal on the curvature of the circle and r is just the density or heatmap. $\endgroup$
    – WaleeK
    Commented Sep 30, 2020 at 8:18
  • $\begingroup$ Then this plot doesn't represent the real geometry, what's the benefit of visualizing the data in this way? $\endgroup$
    – xzczd
    Commented Sep 30, 2020 at 8:26
  • $\begingroup$ It becomes easier to highlight the crystallographic planes, and is visually easier to read. Also somewhat of a common practice in the community I guess. $\endgroup$
    – WaleeK
    Commented Sep 30, 2020 at 8:49

1 Answer 1

4
$\begingroup$

Here's my trial:

SeedRandom[2020]; 
data = Flatten[Table[{th, phi, RandomReal[100]}, {th, 0, 45, 3}, 
                                                 {phi, 0, 90 Degree, 2 Degree}], 1];

func = Interpolation[data];
{{rmin, rmax}, {phimin, phimax}} = func["Domain"];
radian = 32; dphi = 15 Degree;
Legended[ParametricPlot[r {Cos[phi], Sin[phi]}, {r, rmin, rmax}, {phi, phimin, phimax}, 
   ColorFunction -> 
    Function[{x, y, r, phi}, 
     ColorData["Rainbow"]@Rescale[func[r, phi], MinMax@data[[All, 3]]]], 
   ColorFunctionScaling -> False, PlotPoints -> 50, 
   Frame -> {{True, False}, {True, False}}, PlotRangePadding -> {{1, 10}, {1, 10}}, 
   PlotRange -> {{0, rmax}, {0, rmax}}]~Show~
  PolarPlot[radian, {phi, phimin, phimax}, PolarAxes -> Automatic, 
   PolarTicks -> {"Degrees", None}, 
   PolarGridLines -> {Range[phimin, phimax, dphi], Automatic}, GridLinesStyle -> Black,
   PlotRange -> All, PlotStyle -> Transparent], 
 BarLegend[{ColorData["Rainbow"]@Rescale[#, MinMax@data[[All, 3]]] &, 
   MinMax@data[[All, 3]]}]]

enter image description here

The main obstacle that stops me from creating a general-purpose function is, it's not clear how PolarPlot decides the position of PolarAxes. (I ended up with finding the radian = 32; by trial and error. )

$\endgroup$
1
  • $\begingroup$ thank you for the answer, it works perfectly apart from the caveat you mentioned. That I have to change on my overall range of the polar angles. Ah well can't have it all I guess but thanks a lot! $\endgroup$
    – WaleeK
    Commented Sep 30, 2020 at 14:41

Your Answer

By clicking “Post Your Answer”, you agree to our terms of service and acknowledge you have read our privacy policy.

Not the answer you're looking for? Browse other questions tagged or ask your own question.