9
$\begingroup$

I stumbled upon this problem when I was trying to make some nice smooth ListDensityPlots of my numerical data. In short, my problem is that I let Mathematica plot two copies of basically the exact same data points, however, only one half of the plot looks smooth (which is actually the copied half of my data).

To be more concrete, I'll give an example where the same problem occurs. Suppose I have the a table of datapoints, which looks as follows:

Table1=Table[{x, y, 0}, {x, 0, 1, 1/10}, {y, 0, 1, 1/10}] // 
Flatten[#, 1] &;
Table2 = Select[Table1, #[[1]] != #[[2]] &];
data=Join[Table2, Table[{x, x, 1}, {x, 0, 1, 1/10}]];

Then I can make a ListDensityPlot with

ListDensityPlot[data, ColorFunction -> "TemperatureMap", PlotLegends -> Automatic]

which gives

plot1.

This does not look so smooth because the lack of data points, but that's not the problem. Now, I know that my data should be symmetric, so I create a table which gives the same $z$ values for negative values of $x$:

data2 = SortBy[Join[Table[{data[[i]][[1]], data[[i]][[2]], data[[i]][[3]]},
{i, 1, Length[data]}], Table[{-data[[i]][[1]], data[[i]][[2]], data[[i]][[3]]}, 
{i, 1, Length[data]}]], {First, #[[2]]} &];

So basically, I just made a copy of my data, but reflected in the $y$-axis. However, if I now make a ListDensityPlot with

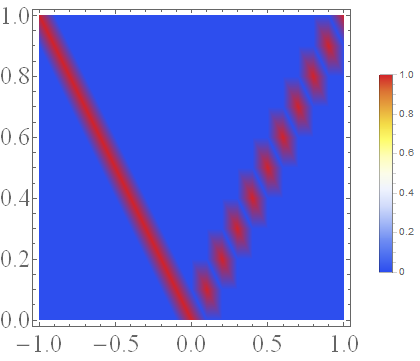
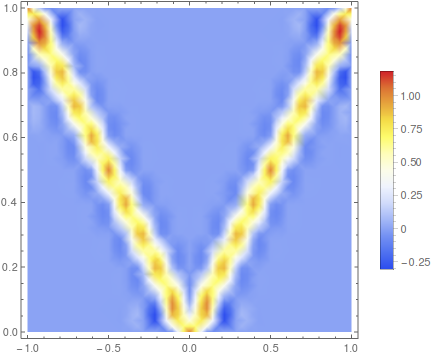
ListDensityPlot[data2, ColorFunction -> "TemperatureMap", PlotLegends -> Automatic]

it looks like this:

plot2.

Somehow, the copied half of the data looks much smoother than the original data! Why?

To be specific, I have the following questions about this:

  • Why is the left half of the second plot smooth, in contrast to the right part?
  • Is there a way to make both parts as smooth as the left half is now? I tried InterpolationOrder, which didn't work.

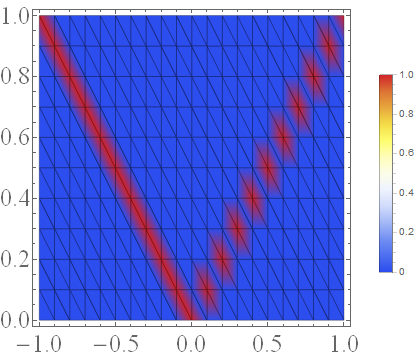
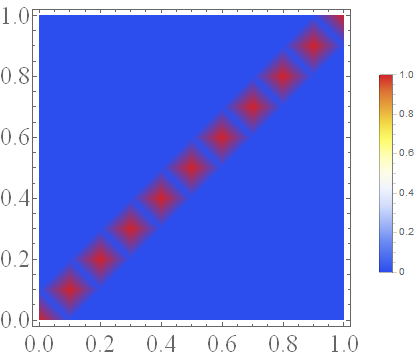
What I further noticed is that when I define data2 as above, but without the SortBy command, the left part does not become smooth. Furthermore, when I add the command Mesh -> All to the second plot, I obtain this:

plot3.

It seems as if the left half is smooth because there are diagonal lines going to the upper left rather than the upper right. I have no idea what these lines mean and why they are there though! However, I think if I might be able to solve my problem if I could make these lines go to the upper right and define data2 without SortBy...

I hope anyone can shed some light on this and explain me why Mathematica plots my data in this way. Thanks in advance.

EDIT:

One solution I found is taking the data from only the left part in the second figure, reflect this to the right part WITHOUT using SortBy and plotting it. Somehow the diagonal Mesh lines are reflected as well then. I have no idea why though, and why Mathematica seems to pick this preferred direction for interpolating in the first place.

$\endgroup$

1 Answer 1

8
$\begingroup$

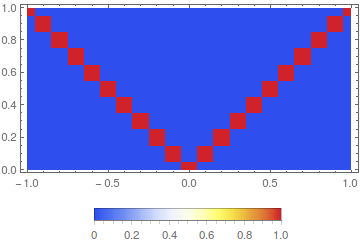
This is due to the interpolation. If you turn off the interpolation by InterpolationOrder -> 0 you will see symmetric plot.

data = Flatten[Table[{x, y, If[x == y, 1, 0]}, 
                     {x, 0, 1, 1/10}, {y, 0, 1, 1/10}], 1];
dataR = data;
dataL = data /. {x_, y_, z_} :> {-x, y, z};

data0 = Join[dataL,dataR]

ListDensityPlot[data0, ColorFunction -> "TemperatureMap", 
  PlotLegends -> Automatic, InterpolationOrder -> 0,AspectRatio->1/2]

enter image description here

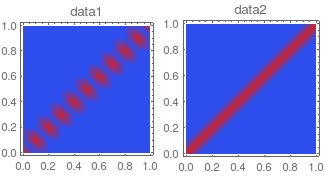
The default interpolation for the density depends on the order of data. For example lets consider ascending and descending order of x for data.

data1 = Sort[dataR, #1[[1]] > #2[[1]] &];
data2 = Sort[dataR, #1[[1]] < #2[[1]] &];
ListDensityPlot[data1, ColorFunction -> "TemperatureMap", PlotLabel -> "data1"]
ListDensityPlot[data2, ColorFunction -> "TemperatureMap", PlotLabel -> "data2"]

enter image description here

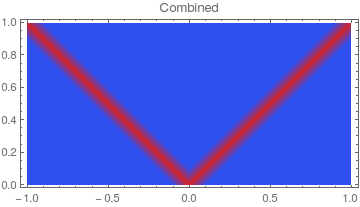
So arranging your data properly will take care of the smoothing.

data1 = Sort[dataL, #1[[1]] > #2[[1]] &];
data2 = Sort[dataR, #1[[1]] < #2[[1]] &];
data0 = Join[data1, data2];
ListDensityPlot[data0, ColorFunction -> "TemperatureMap", 
              PlotLabel -> "Combined", AspectRatio -> 1/2]

enter image description here

Notice that I choose different ordering for left and right section.

Another (not so good) possible way could be using an interpolating function, like

f = Interpolation[data2 // Union];
DensityPlot[f[x, y], {x, -1, 1}, {y, 0, 1}, PlotRange -> All, 
 ColorFunction -> "TemperatureMap", PlotLegends -> Automatic]

enter image description here

$\endgroup$
6
  • $\begingroup$ Thanks, I see... The second plot somehow does not represent the data as I want it though. Actually, what I would want is not to turn of the interpolation as in the first step of your answer, but rather to use the same interpolation in the right half of the plot as well. Any idea how that can be done? $\endgroup$ Commented Jun 13, 2016 at 12:26
  • $\begingroup$ Ah I didn't see your edit! This definitely helps. Using this I found out I can make my second plot smooth if I just sort the data such that the absolute value of the x coordinates increases, and the absolute value of the y coordinates decreases. Thanks! $\endgroup$ Commented Jun 14, 2016 at 9:46
  • $\begingroup$ @ScroogeMcDuck, just make two different sets of data for positive and negative x, sort them individually and Join them. That will work :) $\endgroup$
    – Sumit
    Commented Jun 14, 2016 at 10:56
  • $\begingroup$ I tried this using data for $-5 \leq x\leq 0$ in steps of $\Delta x = 0.1$, copying it, and joining the result. As a result the interpolation was ok on both sides of the y-axis, except for the step from $0$ to $0.1$! In other words the interpolation was along a diagonal to the upper left corner for $-5\leq x \leq 0.1$ and to the upper right for $0.1\leq x \leq 5$ . $\endgroup$ Commented Jun 15, 2016 at 8:14
  • 1
    $\begingroup$ check the modified answer. I put an example of how to combine the data. $\endgroup$
    – Sumit
    Commented Jun 15, 2016 at 8:41

Your Answer

By clicking “Post Your Answer”, you agree to our terms of service and acknowledge you have read our privacy policy.

Not the answer you're looking for? Browse other questions tagged or ask your own question.