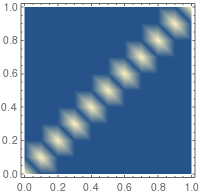
Recently I was trying to answer this question on how to make a smooth ListDensityPlot when I found that the output depends on the order of the data if you are using InterpolationOrder>0. For example
data = Flatten[Table[{x, y, If[x==y, 1, 0]}, {x, 0, 1, 1/10}, {y, 0, 1, 1/10}],1];
ListDensityPlot[data]
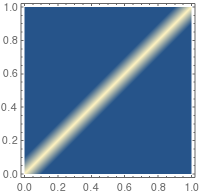
It becomes better if you reorder the data.
data2 = Sort[data, #1[[1]] < #2[[1]] &];
ListDensityPlot[data2]
Instead of changing the data, I guess the same result could be obtained if we can change the interpolation scheme MMA is using. Is there any way to do that?
By interpolation scheme I mean the algorithm MMA is using to produce the data in between two data points to make a smooth figure.
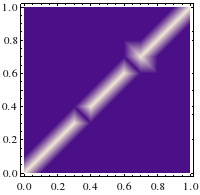
Just for curiosity, I try the same thing with M9.0.1 and this is the result with data2.

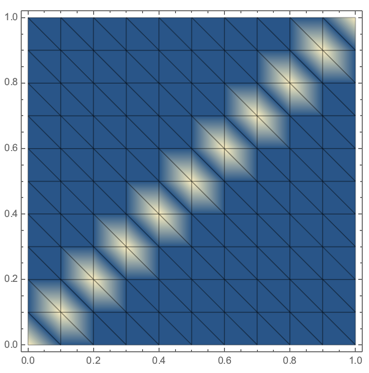
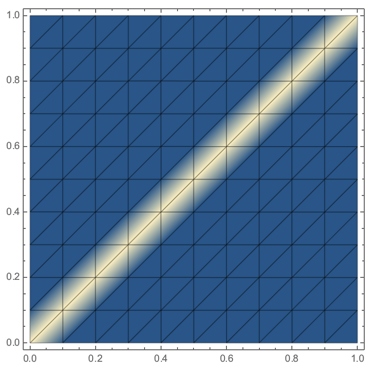
Mesh -> Allto see what is happening. $\endgroup$InterpolationOrderoption. There are two kinds of dataListDensityPlot(orInterpolationitself) can work with: specified as{x,y,f[x,y]}triplets, like you did, or a matrix of values. You could do this as well:gridData = Table[If[x == y, 1, 0], {x, 0, 1, 1/10}, {y, 0, 1, 1/10}]; ListDensityPlot[gridData, Mesh -> All, DataRange -> {{0, 1}, {0, 1}}]. ... $\endgroup$ListDensityPlot[gridData, Mesh -> All, DataRange -> {{0, 1}, {0, 1}}, InterpolationOrder -> 1]I don't know why this happens. Looks like a bug ... $\endgroup$Interpolationuses the first format andListInterpolationthe second format. $\endgroup$InterpolationOrderis 3. I have to check that. It is the direction of interpolation I am interested in. $\endgroup$