6
$\begingroup$

I'm new to Mathematica, and while this is potentially quite easy, I'm having difficulty using TimeObjects in the EventSeries function. After pulling out a column from an original dataset which had a series of time values, I then applied Count as Count @ Original which gave me a table akin to:

Dataset[<|
    DateObject[{2016, 1, 1}, TimeObject[{12, 00, 0.}, TimeZone -> 10.],
        TimeZone -> 10.] -> 26,
    DateObject[{2016, 1, 1}, TimeObject[{01, 00, 0.}, TimeZone -> 10.],
        TimeZone -> 10.] -> 364, 
    DateObject[{2016, 1, 1}, TimeObject[{02, 00, 0.}, TimeZone -> 10.], 
        TimeZone -> 10.] -> 16|>]

My question is 2-fold.

1) How do I pass that dataset to the EventSeries function, to be able to do a TimeSeries-esque plot? I'm finding it particularly difficult to find anything that references passing TimeObjects, hence the question.

2) Given that I am new to Mathematica, my second question is more conceptually, about the easiest way to pass multiple lists (or as I would previously call them, columns of a Dataset) to a function?

$\endgroup$

2 Answers 2

6
$\begingroup$

We can operate upon data contained within dataset by applying query operators. Assume that the dataset described in the question has been assigned to the variable ds. Then, for example, we can convert the embedded association into an event series by applying the EventSeries operator:

ds[EventSeries]

dataset EventSeries screenshot

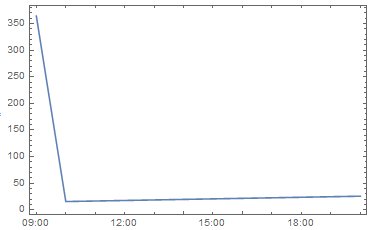
Alternatively, we could produce a plot by composing the EventSeries and DateListPlot operators:

ds[EventSeries /* DateListPlot]

dataset DateListPlot screenshot

It is likely that these operators can be applied directly to your original dataset. Let's consider the following dataset:

ds2 = Query[Dataset, DateObject] @
  {{2016, 1, 1}, {2016, 1, 1}, {2017, 1, 1}, {2017, 1, 1}, {2017, 1, 1}, {2018, 1, 1}};

dataset screenshot

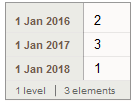
As in the question, we could use Counts @ ds2 to get the number of occurrences of each date as an association (contained in a dataset). But instead, let's express this operation in query form:

ds2[Counts]

<code>Counts</code> screenshot

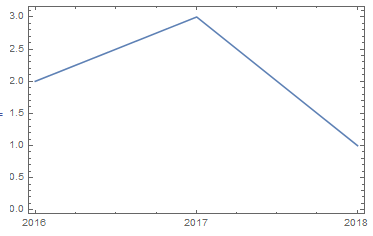
The advantage of using query operator syntax is that we can now compose it with our other query operators to produce the plot directly from the source dataset:

ds2[Counts /* EventSeries /* DateListPlot]

<code>Counts</code> plot screenshot

Dataset query syntax is quite elaborate. It is described in detail by the Dataset and Query documentation.

Applying a Function to Multiple Columns

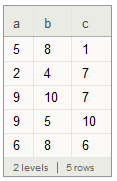
As for the second question, a simple way to apply a function to multiple columns is to use named slot syntax (e.g. #columnName). For example, consider this dataset:

ds3 = Query[Dataset, AssociationThread[{"a", "b", "c"} -> #]&] @ RandomInteger[10, {5, 3}]

three-column dataset screenshot

We can add together the columns a and c by means of the query operator #a + #c&:

ds3[All, #a + #c &]

column sum screenshot

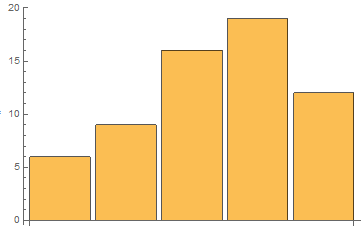
Alternatively, we could produce a bar chart of those sums:

ds3[BarChart, #a + #c &]

bar chart screenshot

$\endgroup$
2
  • 1
    $\begingroup$ The number of ways to apply functions to arbitrary components of a dataset (columns or otherwise) is endless. It might make sense to ask separate, more focused, questions on this topic (or review some of the other questions under the dataset or query tags). $\endgroup$
    – WReach
    Commented Jul 24, 2016 at 18:23
  • $\begingroup$ Thanks. I appreciate that there are a seemingly endless way to apply functions, but I was looking for something a little more general that I can try to apply to each problem before I run into trouble.The extra detail about how to use functions to work with the new dataset was super helpful. $\endgroup$ Commented Jul 25, 2016 at 8:33
4
$\begingroup$

Dataset has only been around since version 10.0, and not all functions support it as yet. However, Association has much broader support and is what Dataset is based on. You can use Normal to convert the Dataset into an Association. EventSeries can work with associations.

With ds as the Dataset in the above post, then

EventSeries[Normal@ds]

(* EventSeries[Time: 31 Dec 2015 12:00:00 to 31 Dec 2015 23:00:00   Data points: 3] *)

Hope this helps.

$\endgroup$

Your Answer

By clicking “Post Your Answer”, you agree to our terms of service and acknowledge you have read our privacy policy.

Not the answer you're looking for? Browse other questions tagged or ask your own question.