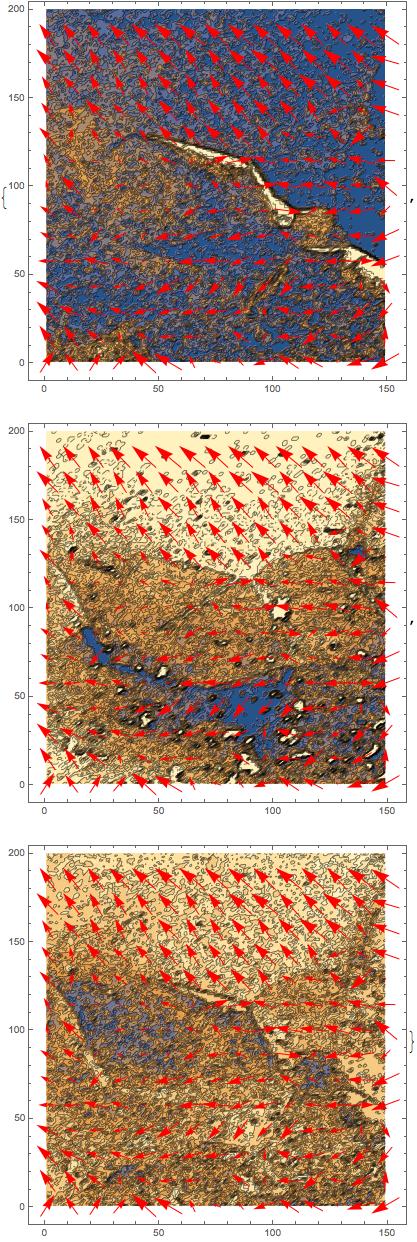
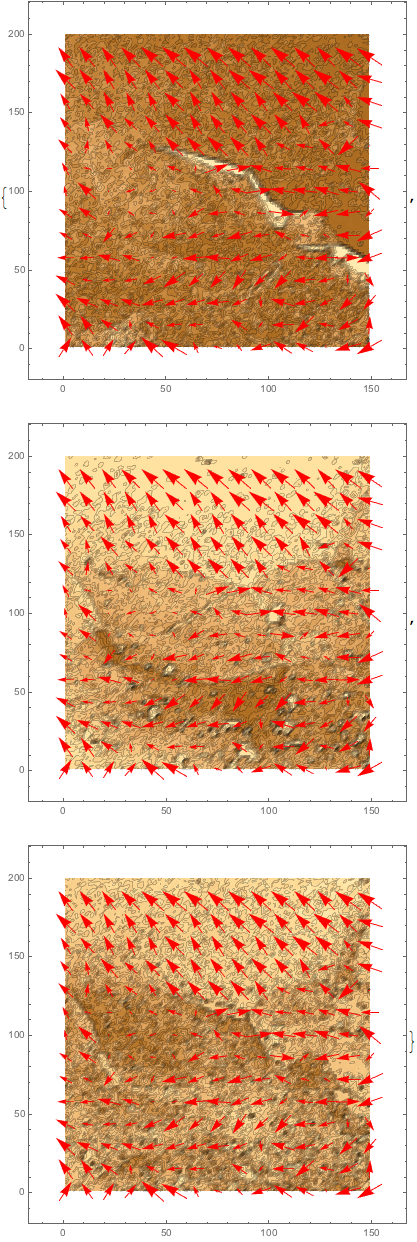
I dont know why so many plot functions lack the option to display contour lines (judging by the search result for [plot function] contour lines) but ListVectorPlot is among them.
If I have an array t of {vx,vy} coordinates, do you know a way to plot it with overimposed the contour lines?


ListVectorDensityPlot[]? It doesn't have lines, but really lines just clutter up such a graph. You might have to superimpose two graphs if you really want the lines themselves. $\endgroup$MeshFunctions. $\endgroup$StreamPointsoptionVectorPlotandListVectorPlot. Second, you could just useShowto combine different types of 2D plots $\endgroup$