7
$\begingroup$

I am trying to plot how the eigenvalues of a matrix change by changing a given a parameter t. Of course the ordering of the eigenvalues does not matter mathematically but it does when I want to make nice plots.

I know that the eigenvalues will change smoothly as a function of this parameter, is there any way to impose this rule on the way eigenvalues are ordered?

Here is a bit of code that plots the eigenvalues as a function of time (I am sorting the values because otherwise I get a lot of jumps):

ham = 1/2*{{0, Ωp, 0}, {Ωp, 
     2 Δp, Ωs}, {0, Ωs, 
     2*(Δp - Δs)}}; 
amp = 100; 
t0 = -120.0; 
dt = 45; 
δ = -999;
δp = -1000.; 
σ = 25.3; 
mat = ham /. {Ωs -> 
    amp*Exp[-(t/σ)^2], Ωp -> 
    amp*Exp[-((t + 
            dt)/σ)^2], Δp -> δp, \
Δs -> δ}
Plot[{(Sort@{Eigenvalues[mat][[2]], 
      Eigenvalues[mat][[3]]})[[1]], (Sort@{Eigenvalues[mat][[2]], 
      Eigenvalues[mat][[3]]})[[2]]}, {t, t0, -t0}, Frame -> True, 
 Axes -> False]

What I am trying to fix is shown below. The eigenvalue should change smoothly so at the crossing point the red color should follow all the way down.

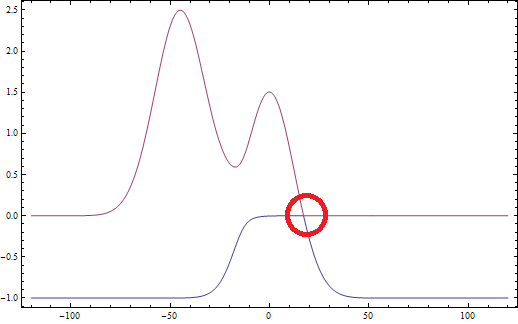
The eigenvalue should change smoothly so at the crossing point the red color should follow all the way down.
$\endgroup$
1

1 Answer 1

7
$\begingroup$

A solution (ok, a dirty hack) I found based on the suggestion by Szabolcs is finding the parameter t for which the distance between the two eigenvalues is the smallest by using NMinimize and reversing the ordering of the functions. However if there are more than one crossing it would have to be done for each crossing individually...

I am still hoping that there is perhaps a more elegant solution. For now I will post my hack version anyway in case it might help someone in a similar situation.

ham = 1/2*{{0, Ωp, 0}, {Ωp, 
     2 Δp, Ωs}, {0, Ωs, 
     2*(Δp - Δs)}}; 
amp = 100; 
t0 = -120.0; 
dt = 45; 
δ = -999;
δp = -1000.; 
δ = 25.3; 
mat = ham /. {Ωs ->amp*Exp[-(t/σ)^2], Ωp ->amp*Exp[-((t + dt)/σ)^2], Δp -> δp,Δs ->δ}
t2 = t /. NMinimize[(Eigenvalues[mat][[2]] - Eigenvalues[mat][[3]])^2, t][[2]]
Show[
Plot[{(Sort[{Eigenvalues[mat][[2]], 
           Eigenvalues[mat][[3]]},Less])[[1]], (Sort[{Eigenvalues[mat][[2]], 
           Eigenvalues[mat][[3]]},Less])[[2]]}, {t, t0, t2}],

Plot[{(Sort[{Eigenvalues[mat][[2]], Eigenvalues[mat][[3]]}, 
      Greater])[[1]], (Sort[{Eigenvalues[mat][[2]], 
       Eigenvalues[mat][[3]]}, Greater])[[2]]}, {t, t2, -t0}]
]

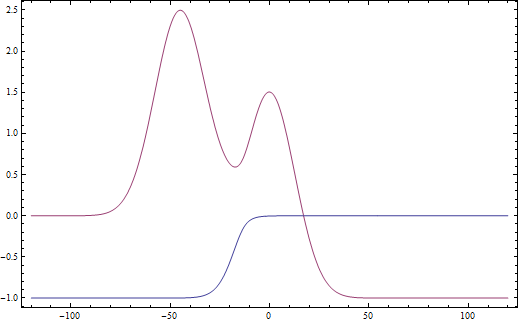
Here are the results:

enter image description here

$\endgroup$

Your Answer

By clicking “Post Your Answer”, you agree to our terms of service and acknowledge you have read our privacy policy.

Not the answer you're looking for? Browse other questions tagged or ask your own question.