6
$\begingroup$

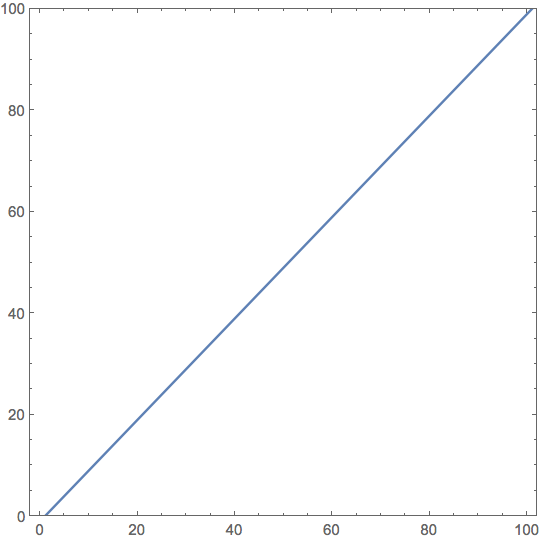
I have strange problem with Wolfram Mathematica's function RegionPlot

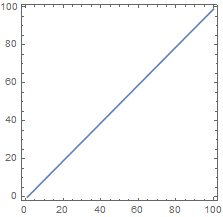
RegionPlot[x - y == 0, {x, 0, 100}, {y, 0, 100}]

the result is:

enter image description here

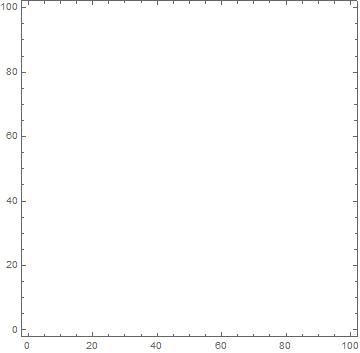
But when I try

RegionPlot[x - y == 1, {x, 0, 100}, {y, 0, 100}]

enter image description here

Do you know what I am doing wrong? Thanks!

$\endgroup$
3
  • 4
    $\begingroup$ Documentation states that "RegionPlot will only visualize two-dimensional regions: ". So, the question is, why did the first plot show a line? $\endgroup$
    – bbgodfrey
    Commented Feb 28, 2016 at 15:53
  • $\begingroup$ I'm doing exercise in which I need to use function RegionPlot to draw a line, but I guess there must be an error in exercise. $\endgroup$
    – user38129
    Commented Feb 28, 2016 at 16:01
  • $\begingroup$ There is not an error in your exercise! $\endgroup$
    – user36273
    Commented Feb 28, 2016 at 16:17

4 Answers 4

6
$\begingroup$

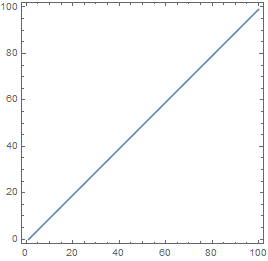
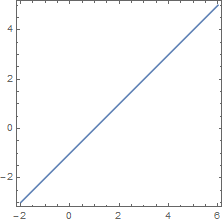
Starting with v10.0 you can use InfiniteLine

RegionPlot[
 InfiniteLine[{x, x - 1} /. {{x -> 0}, {x -> 1}}], 
 PlotRange -> {0, 100}]

enter image description here

$\endgroup$
9
$\begingroup$

What do you want

ContourPlot[x - y == 1, {x, 0, 100}, {y, 0, 100}]

enter image description here

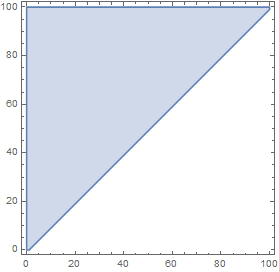
or should it be

RegionPlot[x - y < 1, {x, 0, 100}, {y, 0, 100}]

enter image description here

Addendum for exercise. You have to define a region!

reg = ImplicitRegion[x - y == 1, {x, y}];
RegionPlot@reg

enter image description here

reg = ImplicitRegion[x - y == 1 && 0 < x < 100 && 0 < y < 100, {x, y}];
RegionPlot@reg

enter image description here

RegionPlot will only visualize two-dimensional regions. See the documentation "Possible Issues".

$\endgroup$
4
  • $\begingroup$ I'm doing exercise in which I need to use function RegionPlot to draw a line. $\endgroup$
    – user38129
    Commented Feb 28, 2016 at 15:57
  • 1
    $\begingroup$ @rewi Why did the first example work? This seems to be a one-dimensional region which violates the Possible Issues in the documentation. $\endgroup$ Commented Feb 28, 2016 at 16:20
  • $\begingroup$ @Jack LaVigne Unfortunately, I also know not all :) $\endgroup$
    – user36273
    Commented Feb 28, 2016 at 16:24
  • 2
    $\begingroup$ @JackLaVigne The example in possible issues seems to need modification since the introduction of ImplicitRegions $\endgroup$
    – Coolwater
    Commented Feb 28, 2016 at 19:39
4
$\begingroup$

Correction:

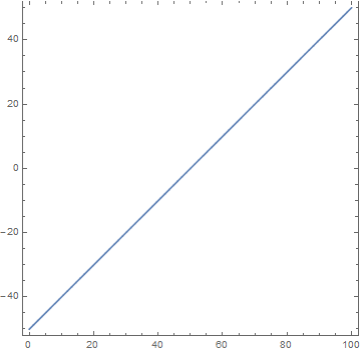
RegionPlot[x - y == 1, {x, 0, 100}, {y, -1, 99}]

Why does it work? Consider the following example. RegionPlot understands True statement (put any a).

With[{a = 50}, 
 RegionPlot[x - y == a, {x, 0, 100}, {y, 0 - a, 100 - a}]]

enter image description here

$\endgroup$
1
  • 1
    $\begingroup$ +1 I think you have nailed it. Excellent explanation. $\endgroup$ Commented Feb 28, 2016 at 22:05
0
$\begingroup$

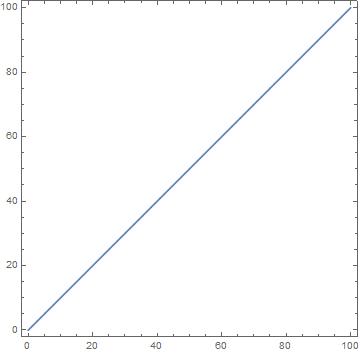
Due to the sampling pattern used by RegionPlot, it is lucky that it finds the line in your first example. Consider the output of

noisyFunction[x_, y_] := Module[{},
    Sow[{x, y}];
    x - y
];
ListPlot[
  Take[
    Reap[
      RegionPlot[noisyFunction[x, y] == 0, {x, 0, 100}, {y, 0, 100}]
    ][[2, 1]],
  {4, -1}]
]

The clustering of samples around the line is easily seen. But RegionPlot is not lucky for your second example.

ListPlot[
  Take[
    Reap[
      RegionPlot[noisyFunction[x, y] == 1, {x, 0, 100}, {y, 0, 100}]
    ][[2, 1]],
  {4, -1}]
]

One should use EvaluationMonitor if one is going to be serious about inspecting the evaluation set of a function fed to a plot or numerical search.

$\endgroup$

Your Answer

By clicking “Post Your Answer”, you agree to our terms of service and acknowledge you have read our privacy policy.

Not the answer you're looking for? Browse other questions tagged or ask your own question.