Formatted code
Source Link
MarcoB
  • 67.7k
  • 18
  • 96
  • 198

I have strange problem with Wolfram Mathematica's function RegionPlot

RegionPlot[x - y == 0, {x, 0, 100},Mathematica's function {y, 0, 100}]RegionPlot

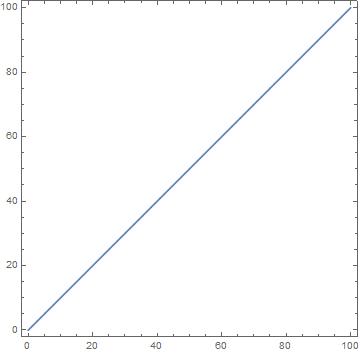
RegionPlot[x - y == 0, {x, 0, 100}, {y, 0, 100}]

the result is:

enter image description here

But when I try

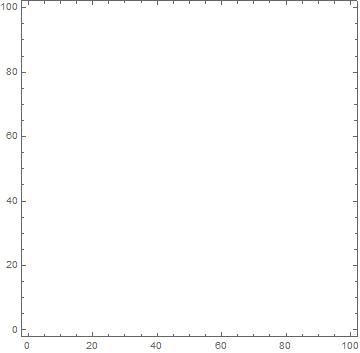
RegionPlot[x - y == 1, {x, 0, 100}, {y, 0, 100}]

RegionPlot[x - y == 1, {x, 0, 100}, {y, 0, 100}]

enter image description here

Do you know what I am doing wrong? Thanks!

I have strange problem with Wolfram Mathematica's function RegionPlot

RegionPlot[x - y == 0, {x, 0, 100}, {y, 0, 100}]

the result is:

enter image description here

But when I try

RegionPlot[x - y == 1, {x, 0, 100}, {y, 0, 100}]

enter image description here

Do you know what I am doing wrong? Thanks!
I have strange problem with Wolfram Mathematica's function RegionPlot

RegionPlot[x - y == 0, {x, 0, 100}, {y, 0, 100}]

the result is:

enter image description here

But when I try

RegionPlot[x - y == 1, {x, 0, 100}, {y, 0, 100}]

enter image description here

Do you know what I am doing wrong? Thanks!
Source Link

RegionPlot strange problem

I have strange problem with Wolfram Mathematica's function RegionPlot

RegionPlot[x - y == 0, {x, 0, 100}, {y, 0, 100}]

the result is:

enter image description here

But when I try

RegionPlot[x - y == 1, {x, 0, 100}, {y, 0, 100}]

enter image description here

Do you know what I am doing wrong? Thanks!