6
$\begingroup$

I have:

f[x_] := Piecewise[{{x, 0 <= x < 1}, {2 - x, 1 <= x < 3}, {x - 4, 
    3 <= x < 4}}]
Plot[f[x], {x, 0, 4}]

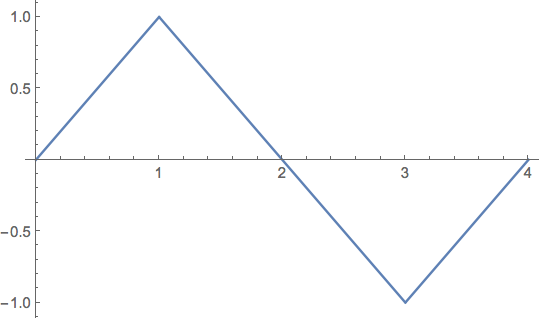
Which produces this plot:

enter image description here

I'm looking for a simple way to convert this into a periodic function so that this image repeats itself every 4 units, in either the positive or negative direction along the x-axis.

Anybody have an idea?

$\endgroup$
0

1 Answer 1

13
$\begingroup$
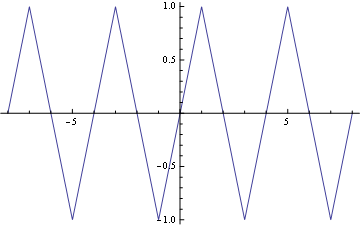
f1[y_] := f[Mod[y, 4]]
Plot[f1[x], {x, -8, 8}]

Mathematica graphics

$\endgroup$
2
  • $\begingroup$ Is that a Plot1 there instead of a Plot? And, after I changed it to a Plot, I got your plot, by mine had breaks in it. I can post it if you want. $\endgroup$
    – David
    Commented Feb 9, 2016 at 4:43
  • $\begingroup$ @David Sorry, finger misplaced. You may get those blanks disappearing by increasing the PlotPoints Option $\endgroup$ Commented Feb 9, 2016 at 5:00

Not the answer you're looking for? Browse other questions tagged or ask your own question.