1
$\begingroup$

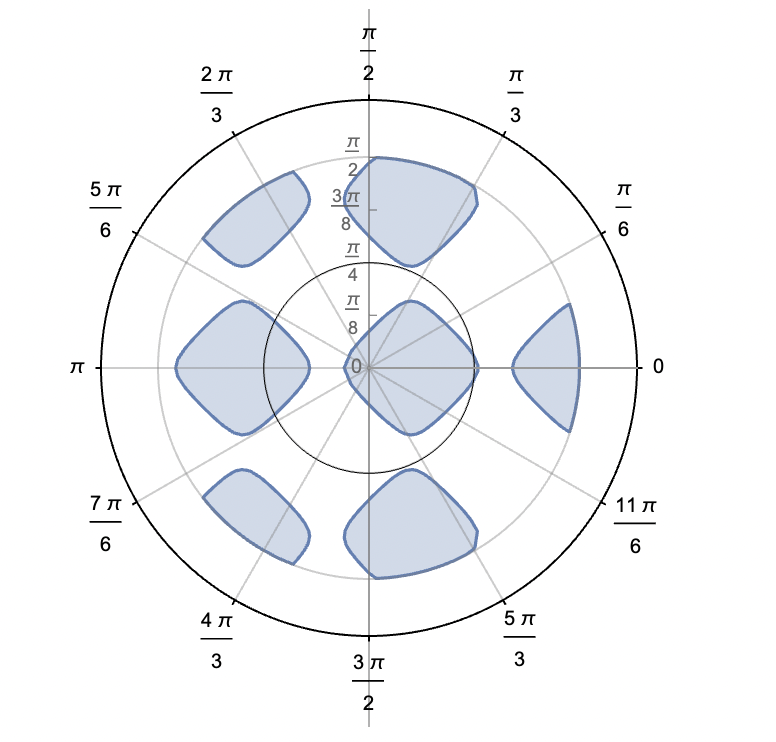
I'm trying to plot the region where some complicated function $f$ is positive, within the circular region 0<R<π/2. I based my code off this answer, however the resulting polar axes do not appear at π/2, as I specified.

eps = 1
RegionPlot[ Sin[5 x] + Cos[5 y] > 0.2 && Sqrt[x^2 + y^2] < \[Pi]/2,
 {x, -\[Pi]/2 - eps, \[Pi]/2 + eps}, {y, -\[Pi]/2 - eps, \[Pi]/2 + 
   eps},
 Frame -> False,
 Axes -> {False, True},
 Ticks -> {False, Range[0, \[Pi]/2, \[Pi]/8]},
 Epilog -> PolarPlot[{\[Pi]/4}, {\[Theta], 0, 2 \[Pi]},
    PolarAxes -> True,
    (*PlotRange\[Rule]\[Pi],*)
    PolarAxesOrigin -> {0, \[Pi]/2}, (* does not seem to do  what it's meant to *)
    PolarGridLines -> {Automatic, {0, \[Pi]/4, \[Pi]/2}},
    PolarTicks -> {Drop[Table[i, {i, 0, 2 Pi, Pi/6}], -1], None},
     PlotStyle -> {Black, Thin}
    ][[1]]]

Output:

enter image description here

Note that I'm deliberately not using the radial polar axis, since I can't find a simple way to make it plot in units of π.

Is this a mistake on my part, or an obscure bug?

$\endgroup$

2 Answers 2

1
$\begingroup$

It does look like "an obscure bug".

A work-around is to construct the polar axes/ticks primitives from scratch. The function polarAxes below creates angular and radial axes/ticks/gridlines given a radial range (radius), angular axis origin (startingangle) and specs for angular/radial ticks/gridlines (each can be specified as an integer or a list). The last two parameters control tick length and radial range padding, respectively.

ClearAll[polarAxes]
polarAxes[radius_: 1, startingangle_: Automatic, angulardivs_: Automatic, 
  radialdivs_: Automatic, angulargridlines_: Automatic, 
  radialgridlines_: Automatic, ticklength_: Automatic, axisoffset_: Automatic] := 
 Module[{angularticks, radialticks, 
   r = radius (1 + axisoffset /. Automatic -> .02), 
   sa = startingangle /. Automatic -> 0, tl = ticklength /. Automatic -> .05}, 
  angularticks = Switch[angulardivs, 
    _Integer, CirclePoints[{r, sa}, angulardivs],
    _List, r Transpose[Through@{Cos, Sin} @ Mod[angulardivs + sa, 2 π]],
    _, CirclePoints[{r, sa}, 12]]; 
  radialticks = Switch[radialdivs, 
    _Integer, Thread[{Subdivide[radius, radialdivs], 0}],
    _List, Thread[{radialdivs, 0}], 
    _, Thread[{Subdivide[radius, 4], 0}]]; 
  {GrayLevel[.4], AbsoluteThickness[.2],
   Circle[{0, 0}, r], 
   Line[{#, #  (1 + tl)}] & /@ angularticks,  
   Line[{{0, 0}, #}] & /@ Switch[angulargridlines, 
    _Integer, CirclePoints[{r, sa}, angulargridlines],
    _List, r Transpose[Through@{Cos, Sin}[Mod[angulargridlines + sa, 2 π]]], 
    _, angularticks],
   Circle[{0, 0}, #] & /@ Switch[radialgridlines, 
    _Integer, Subdivide[radius, radialgridlines], 
    _List, radialgridlines, 
    _, radialticks[[All, 1]]], 
   MapThread[Text[#, (1 + 3 tl/2) #2, -#2/2] &, 
     {Most @ Subdivide[0, 2 π, Length @ angularticks], angularticks}],
   GeometricTransformation[{
     MapThread[Rotate[Text[#, Offset[{0, -5}, #2 + {0, -r tl}], {0, 1}], -sa] &,
        {radialticks[[All, 1]], radialticks}], 
     Line[{#, # + {0, -r tl}}] & /@ radialticks}, 
    RotationTransform[sa]]}]

Examples:

eps = 1;
RegionPlot[Sin[5 x] + Cos[5 y] > 0.2 && Sqrt[x^2 + y^2] < π/2,
  {x, -π/2 - eps, π/2 + eps}, {y, -π/2 - eps, π/2 + eps}, 
 ImageSize -> 700, Frame -> False, Axes -> False, 
 Epilog -> {FontSize -> 12, polarAxes[π/2]}]
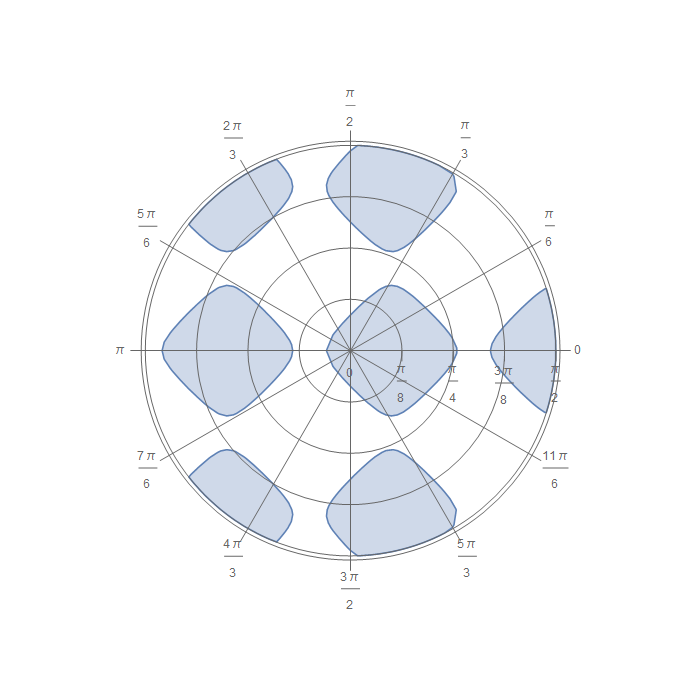
enter image description here

Use polarAxes[π/2, π/4] to make the angular axis start at π/4:
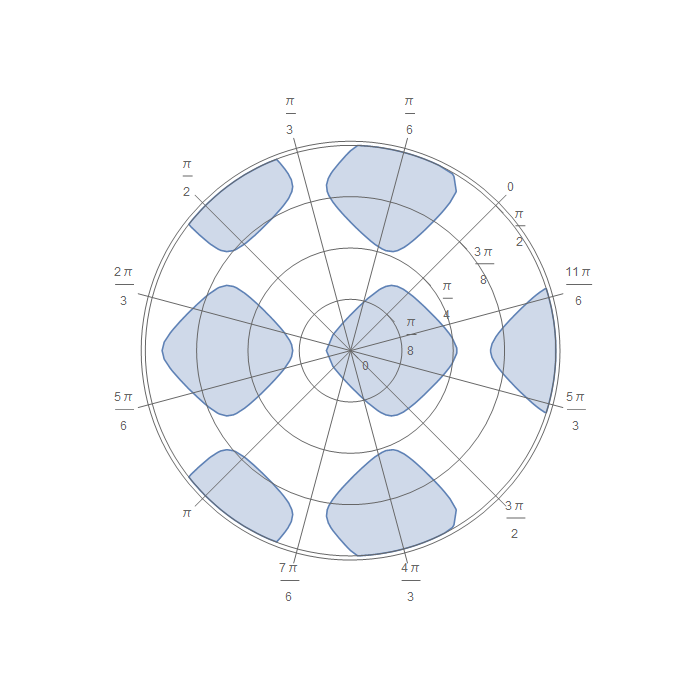
enter image description here

Use polarAxes[π/2, π/4, 8, Automatic, {0, π/6, π/4, π/2, π, 5 π/6, 17 π/12}, 5] to get 5 radial grid lines and angular grid lines at {0, π/6, π/4, π/2, π, 5 π/6, 17 π/12}:
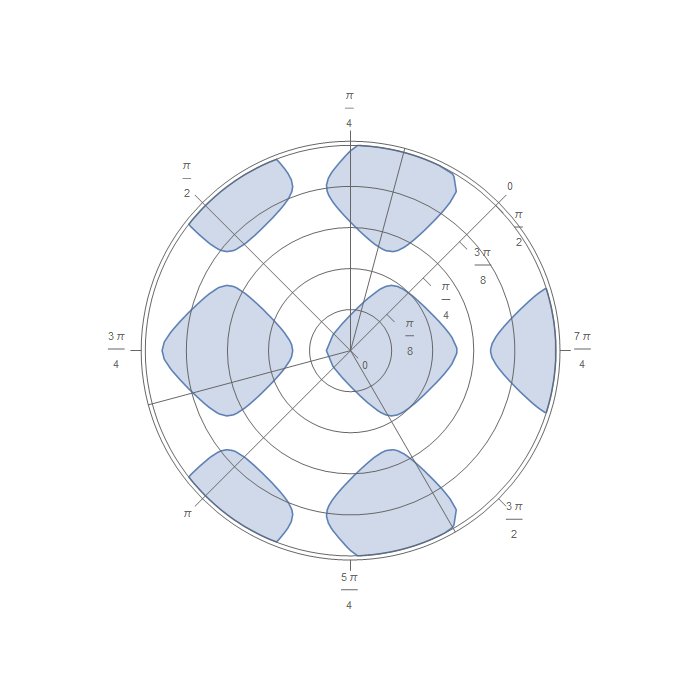
enter image description here

Use polarAxes[π/2, π/4, {0, π/6, π/4, π/2, π, 5 π/6, 17 π/12}, 5, Automatic, 5] to get angular ticks and gridlines at specified angles and 5 radial ticks/gridlines:
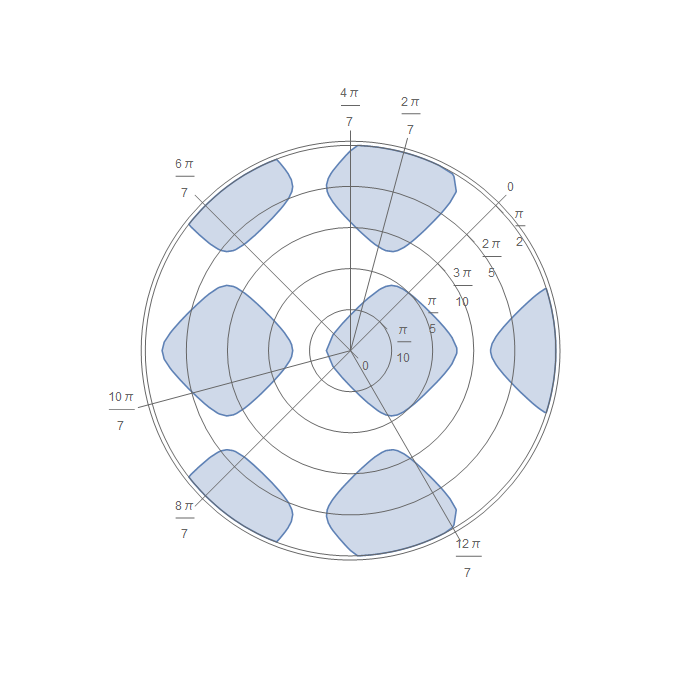
enter image description here

$\endgroup$
0
$\begingroup$

Consider:

PolarTicks -> {Drop[Table[i, {i, 0, 2 Pi, Pi/6}], -1], None}

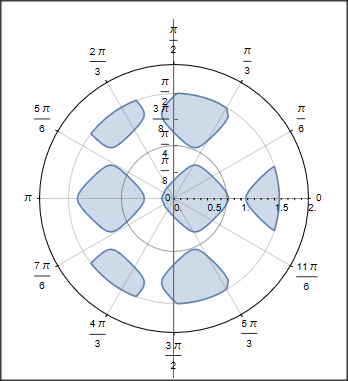
This specifies that you do not want an r-axis with radial ticks. Change "None" e.g. to "Automatic":

eps = 1
RegionPlot[
 Sin[5 x] + Cos[5 y] > 0.2 && 
  Sqrt[x^2 + y^2] < \[Pi]/2, {x, -\[Pi]/2 - eps, \[Pi]/2 + 
   eps}, {y, -\[Pi]/2 - eps, \[Pi]/2 + eps}, Frame -> False, 
 Axes -> {False, True}, Ticks -> {False, Range[0, \[Pi]/2, \[Pi]/8]}, 
 Epilog -> 
  PolarPlot[{\[Pi]/4}, {\[Theta], 0, 2 \[Pi]}, 
    PolarAxes -> True,(*PlotRange\[Rule]\[Pi],*)
    PolarAxesOrigin -> {0, \[Pi]/2}, 
    PolarGridLines -> {Automatic, {0, \[Pi]/4, \[Pi]/2}}, 
    PolarTicks -> {Drop[Table[i, {i, 0, 2 Pi, Pi/6}], -1], Automatic},
 PlotStyle -> {Black, Thin}][[1]]]

enter image description here

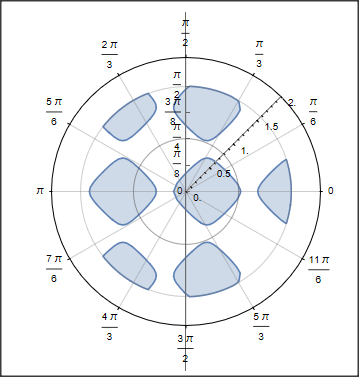
Or with rotated r-axis:

eps = 1
RegionPlot[
 Sin[5 x] + Cos[5 y] > 0.2 && 
  Sqrt[x^2 + y^2] < \[Pi]/2, {x, -\[Pi]/2 - eps, \[Pi]/2 + 
   eps}, {y, -\[Pi]/2 - eps, \[Pi]/2 + eps}, Frame -> False, 
 Axes -> {False, True}, Ticks -> {False, Range[0, \[Pi]/2, \[Pi]/8]}, 
 Epilog -> 
  PolarPlot[{\[Pi]/4}, {\[Theta], 0, 2 \[Pi]}, 
    PolarAxes -> True,(*PlotRange\[Rule]\[Pi],*)
    PolarAxesOrigin -> {Pi/4, Pi/2}, 
    PolarGridLines -> {Automatic, {0, \[Pi]/4, \[Pi]/2}}, 
    PolarTicks -> {Drop[Table[i, {i, 0, 2 Pi, Pi/6}], -1], Automatic},
     PlotStyle -> {Black, Thin}][[1]]]

enter image description here

$\endgroup$
3
  • $\begingroup$ Sorry if my question was unclear, but the specific piece I was concerned about was that the radial outer circle (i.e. the theta axis) seems to have a radius larger than π/2, when I would strongly prefer it to have a radius of exactly π/2. $\endgroup$ Commented Jun 13, 2021 at 1:51
  • 2
    $\begingroup$ This seems to be a bug. Report it tp [email protected] $\endgroup$ Commented Jun 13, 2021 at 7:35
  • $\begingroup$ It's been reported, and Wolfram support have come back to me confirming that this is indeed a bug in PolarPlot. Until it's fixed in production, kglr's manual workaround was good enough for me. $\endgroup$ Commented Jul 9, 2021 at 7:39

Your Answer

By clicking “Post Your Answer”, you agree to our terms of service and acknowledge you have read our privacy policy.

Not the answer you're looking for? Browse other questions tagged or ask your own question.