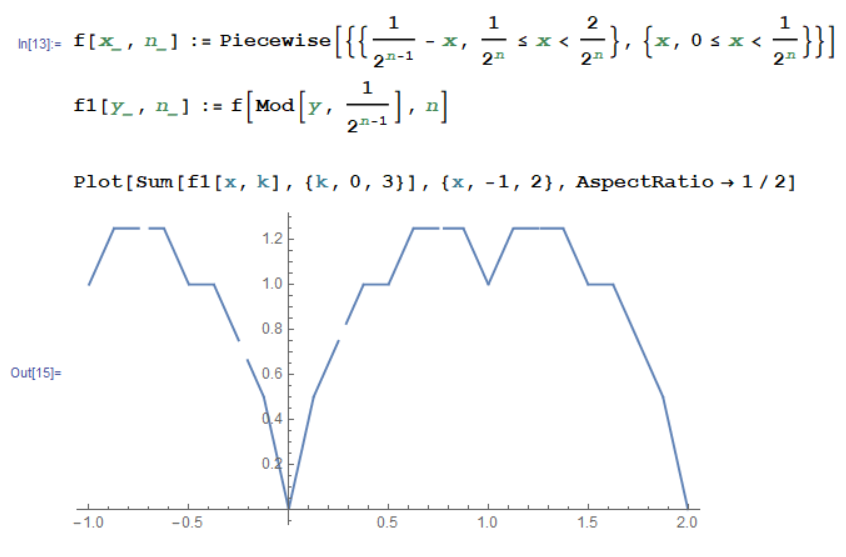
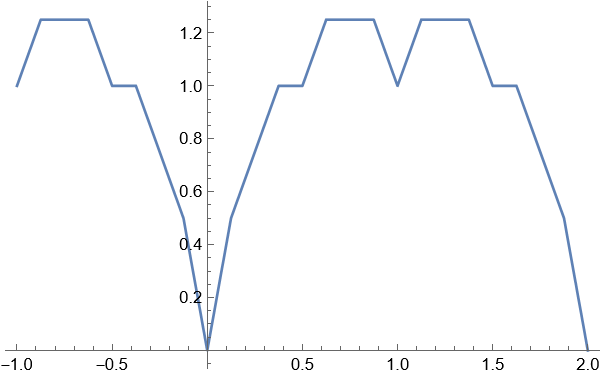
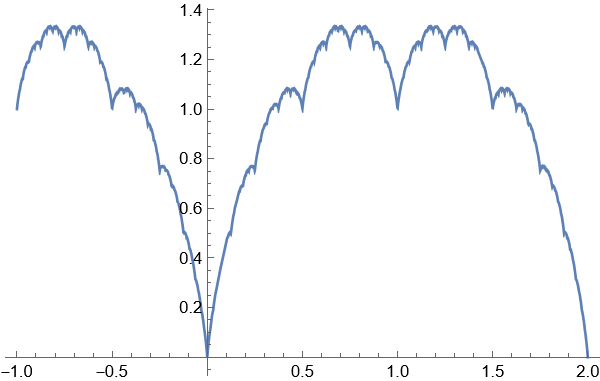
I refer to this post and try to plot a piecewise continuous and periodic function. This periodic function is defined as following:
$$h(x)=|x|, x\in [-1,1] , ~h(x+2)=h(x)$$
$$f_n(x)=\frac{1}{2^n}h(2^n x),~~~~g(x)=\sum_{n=0}^\infty f_n(x)$$
I want to plot $g(x)$. Here I only plot for the sum of first four terms, namely $g_3(x)=f_0(x)+f_1(x)+f_2(x)+f_3(x)$.
f[x_, n_] :=
 Piecewise[{{1/2^(n - 1) - x, 1/2^n <= x < 2/2^n}, {x, 0 <= x < 1/2^n}}]

g[y_, n_] := f[Mod[y, 1/2^(n - 1)], n]

Plot[Sum[g[x, k], {k, 0, 3}], {x, -1, 2}, AspectRatio -> 1/2]
But why I got those breaking spacing for those lines in the graph? (I use Mathematica 10.0)


PlotPointsoption improves the situation? $\endgroup$Plot[Sum[g[x, k], {k, 0, 3}] // PiecewiseExpand // Evaluate, {x, -1, 2}, AspectRatio -> 1/2]$\endgroup$MaxRecursionsthat should enable smaller values forPlotPoints$\endgroup$