Here is some code I used, which may partially answer your question. The key is to calculate efficiently points near the border of the Mandelbrot set. These points have large iteration counts which, when iterated, produce the Buddhabrot form.
The algorithm linked to in the question
uses an adaptive mesh of squares to locate border points.
The alternate code below was developed from pages 896 to 901 of Chaos and Fractals by Peitgen, Jürgens, and Saupe. Their technique follows directly the boundary of the Mandelbrot set with triangles of a given size, without
adapting a mesh covering the entire region of interest. I am not sure
of the comparitive efficiency of the two algorithms, but I like the chances of the triangulation approach.
A non-detailed outline of the algorithm follows.
Triangle vertices are labelled with 0 if they are outside the set,
and with 1 if they are inside the set. Hence, each vertex is stored as
{x,y,m}, where x and y are the real and imaginary coordinates of the
vertex, and m=1 if the vertex is inside the set, and m=0 otherwise.
Define an initial triangle located on the horizontal x axis with sides dx.
Increase the initial x=0.2 by dx until the point {x,0} is outside the set.
Complete the initial triangle with {x,dx} labelled with its membership value.
InitialTriangle[dx_] :=
   Block[{x = 0.2},
         While[Quiet[MandelbrotSetMemberQ[x]], x += dx];
         {{x - dx, 0.0, 1},
          {x, 0.0, 0},
          {x, dx, Boole[Quiet[MandelbrotSetMemberQ[x + I*dx]]]}}]
The new point defining the new triangle is znew = zinside + zoutside - zflip.
The function BorderTriangles[dx] constructs a chain of triangles, stopping
when it reaches the starting triangle again.
BorderTriangles[dx_] :=
   Block[{t, t1, zflip, zin, zout, znew},
         t = InitialTriangle[dx];
         t1 = Sort[Round[t, 10.^-10]];
         If[t[[3, 3]] == 1,
            zflip = t[[1]]; zin = t[[3]]; zout = t[[2]],
            zflip = t[[2]]; zin = t[[1]]; zout = t[[3]]
         ];
         t = {t}; (* enclose in braces for Join below *)
         While[
            znew = zin + zout - zflip;
            If[Quiet[MandelbrotSetMemberQ[Most[znew].{1, I}]],
               zflip = zin; zin = ReplacePart[znew, 3 -> 1], (* same zout *)
               zflip = zout; zout = ReplacePart[znew, 3 -> 0] (* same zin *)
            ];
            Sort[Round[{zflip, zin, zout}, 10.^-10]] =!= t1,
            t = Join[t, {{zflip, zin, zout}}]
         ];
         t]
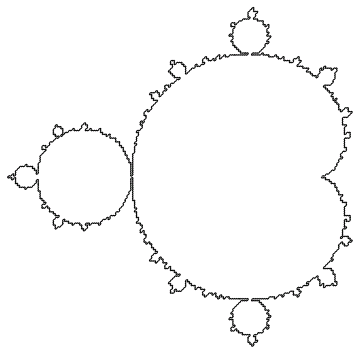
Plot the line connecting all triangle centres. These centroids are good candidates
for points with large iteration counts.
Graphics[Line[Map[Most[Mean[#]] &, BorderTriangles[0.01]]]]
The function DeepPoints[dx,itmin,itmax] finds iteration points near the border
with iteration counts between itmin and itmax.
DeepPoints[dx_, itmin_, itmax_] :=
   With[{p = Map[Most[Mean[#]] &, BorderTriangles[dx]]},
        Cases[
           Transpose[{p,
               MandelbrotSetIterationCount[p.{1, I}, MaxIterations->itmax]}],
           _?(itmin <= Last[#] < itmax &)]
   ]
Store about 5000 points in the global variable borderpoints.
borderpoints =
   Reverse[SortBy[Map[Flatten, N[DeepPoints[0.001, 1000, 500000]]], Last]];
Given a border point c with a large iteration count, the function iterates[c] calculates the list of iterates of this initial point.
iterates = Compile[{{c, _Real, 1}},
   Map[{Re[#], Im[#]} &,
       NestList[#^2 + {1, I}.c[[{1, 2}]] &, 0.0 + 0.0*I, Floor[c[[3]] - 10]]],
   CompilationTarget -> "C", Parallelization -> True,
   RuntimeAttributes -> {Listable}, RuntimeOptions -> "Speed"];
Calculate an array of bin counts.
Block[{bp, bins, d, p, len, xmin = -1.5, xmax = 1.0, ymin = -1.1, ymax = 1.1,
       delta = 0.005, tx, ty},
   bp = borderpoints[[1;;-1;;5]];
   bins = ConstantArray[0, Floor[{ymax - ymin, xmax - xmin}/delta] + {1, 1}];
   d = Dimensions[bins];
   Do[
      p = Drop[iterates[bp[[j]]], 100];
      len = Length[p];
      Do[
         tx = Floor[(p[[i, 1]] - xmin)/delta] + 1;
         ty = Floor[(p[[i, 2]] + ymax)/delta] + 1;
         If[tx >= 1 && tx <= d[[2]] && ty >= 1 && ty <= d[[1]], bins[[ty, tx]] += 1],
         {i, 1, len}],
      {j, 1, Length[bp]}];
   Export["bins.dat", Transpose[bins]]]
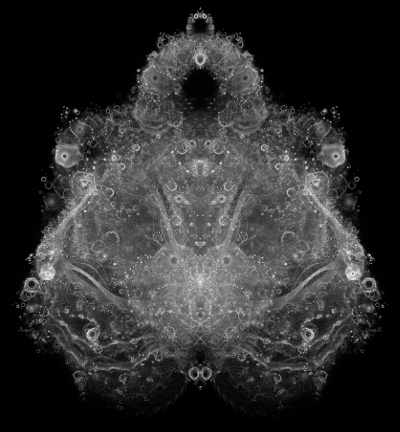
Note the exponent of 0.2 which collapses the range of bin counts so that the colour function displays more detail.
ArrayPlot[
   Import["bins.dat"],
   ColorFunction -> (GrayLevel[#^0.2] &), ImageSize -> 1500]
EDIT
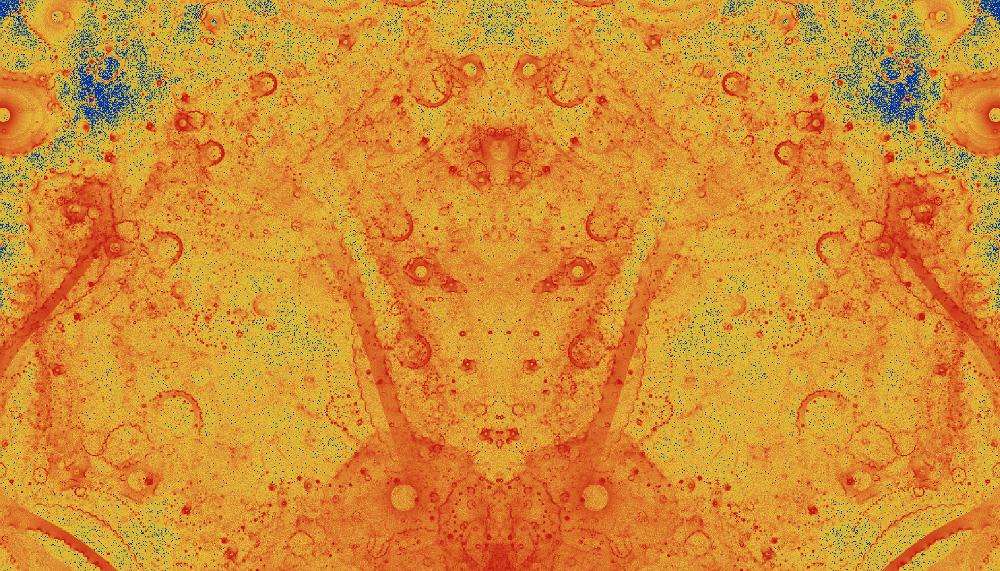
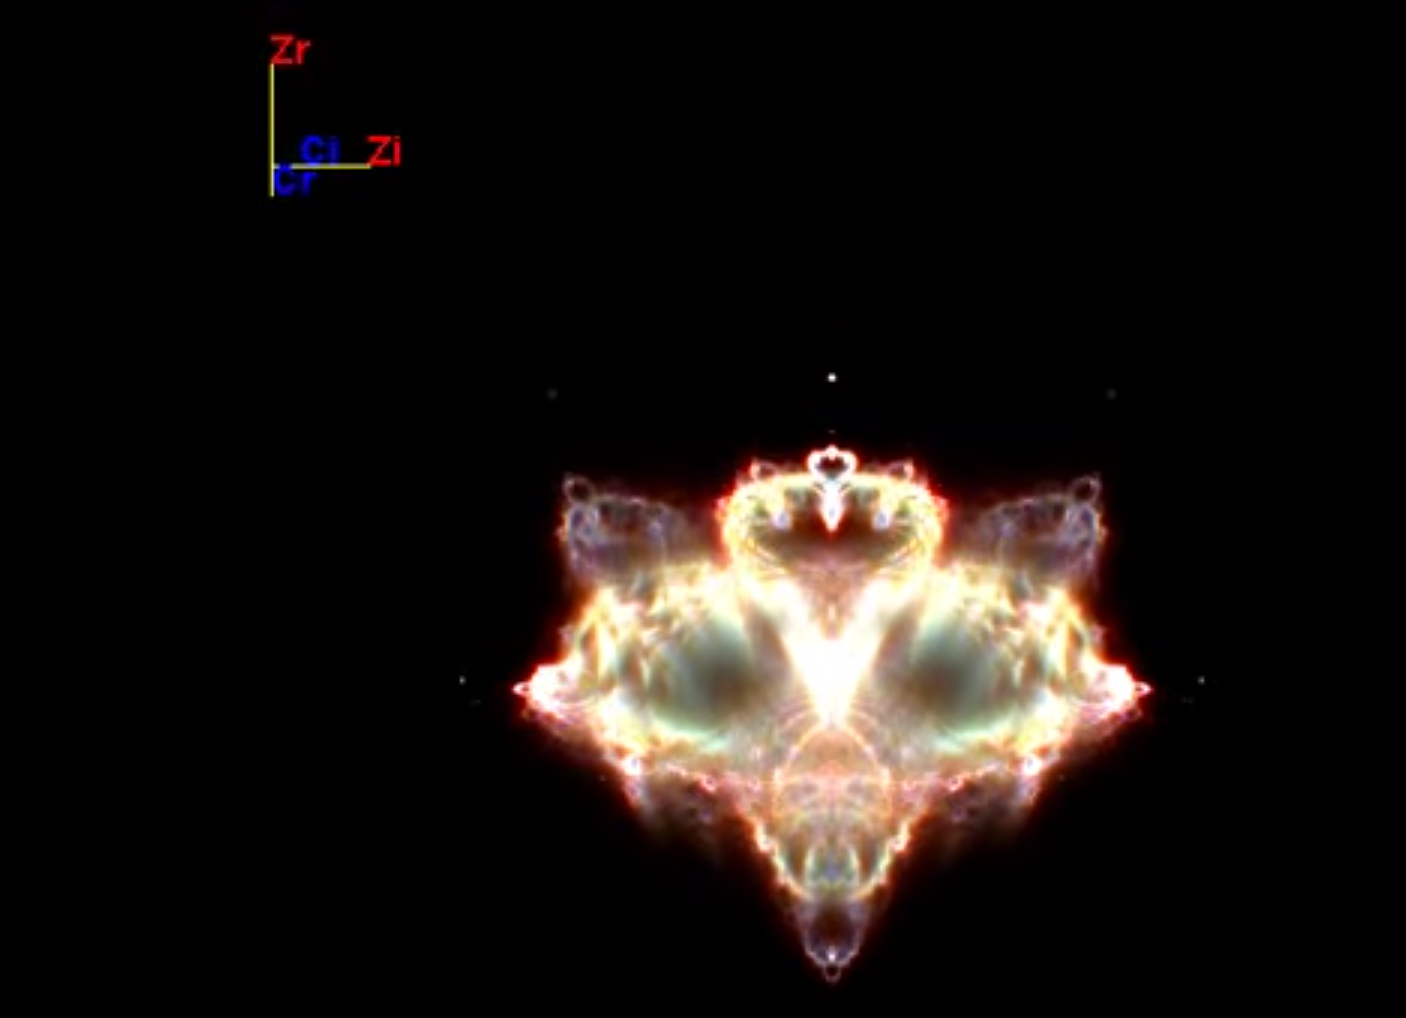
M.R. wanted a colour example, so here is a Buddha Face from the central region. Take the log of the counts in the bins and using exponent 0.4 help make subtle changes visible.
With[{bins = Import["Bins1000_0010.dat"]},
   ArrayPlot[Log[Log[bins + 1.] + 1.],
      ColorFunction -> (ColorData["DarkRainbow", #^0.4] &),
      ColorFunctionScaling -> True, ImageSize -> 800,
      PlotRange -> {{700, 1500}, {400, 1800}}]]


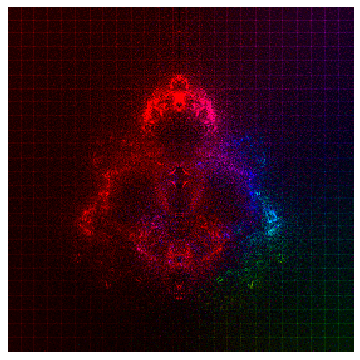


Doloop:If[ 500 <= Mandelbrot[xc + I yc] < 1000, ...$\endgroup$ColorConvert[ Image[Map[{Arg[#]/Pi + 1, Min[Abs[#]/18, 1]} &, image, {2}], ColorSpace -> "HSB"], "RGB"]. $\endgroup$