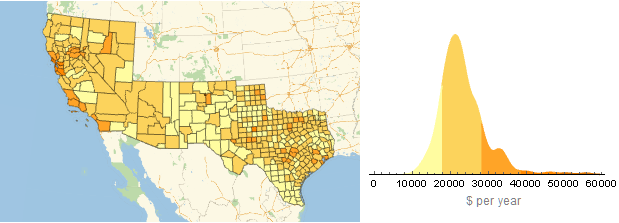
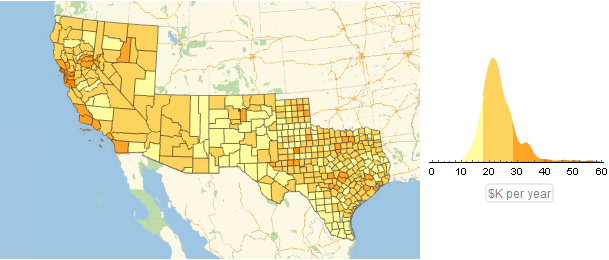
I stumbled across this in the Mathematica documentation and thought it was pretty nifty except that the Histogram that appears as the plot legend is too small so the numbers on the histogram overwrite each other. How do you control the size of the histogram and it's annotation? I tried using LegendSize->2 and LegendSize->{2,2} but these failed. I also tried Needs["PlotLegends`"] to no avail.
counties = EntityValue[Entity["AdministrativeDivision", {_,"Texas" | "NewMexico" | "Arizona" | "Nevada" | "California", "UnitedStates"}], "Entities"];
vals = EntityValue[counties, "PerCapitaIncome"];
pci = GeoRegionValuePlot[Thread[counties -> vals], PlotLegends -> Histogram]


