6
$\begingroup$

I tried the following code:

data = {2, 3, 3, 5, 5, 5, 7, 7, 8, 8, 9, 10, 11, 11, 11, 13, 14, 14, 
   14, 14, 15, 15, 16, 17, 17, 18, 18, 18, 19, 19, 22, 22, 23, 23, 24,
    25, 25, 25, 26, 26, 28, 29, 31, 31, 32, 34, 35, 36, 43, 44, 44, 
   44, 51, 51, 52, 55, 55, 57, 57, 58, 59, 60, 60, 60, 61, 62, 63, 64,
    68, 68, 72, 73, 74, 74, 76, 77, 78, 79, 79, 80, 80, 81, 83, 84, 
   85, 87, 88, 88, 90, 91, 92, 94, 95, 95, 96, 97, 97, 98};

Histogram[data, {1}, Frame -> True, PlotRange -> {{30, 58}, All}, 
 ImageSize -> Medium]

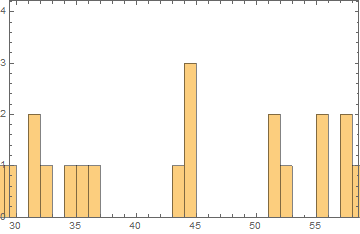
It produces a bar for 29 at left outside of the defined plot range:

enter image description here

What is the reason for that?

$\endgroup$

1 Answer 1

7
$\begingroup$

Histogram does not process the PlotRange option. It just passes it on to the generated Graphics expression. PlotRange in Histogram does not affect how the histogram is computed.

If you want to restrict the domain over which the histogram is computed, use a custom binning specification. Instead of {1}, use {30, 58, 1}.

If you simply want to clip things outside of the frame, use PlotRangeClipping -> True. This does not affect what the Graphics expression contains. It only affects what is drawn on screen. Like PlotRange this is also a Graphics option that Histogram will simply pass on without processing it.

$\endgroup$
0

Your Answer

By clicking “Post Your Answer”, you agree to our terms of service and acknowledge you have read our privacy policy.

Not the answer you're looking for? Browse other questions tagged or ask your own question.