1
$\begingroup$

I have the following Code which calculates the number of edges in a range theta1 and theta2. As seen from this Manipulate, one can arbitrarily choose a lower and upper bound for mm and simply see the associated digraph as well as the total number of edges in it. Basically, this is a histogram of edges, but a very disaggragted one.

Clear[mm, vLabels, selectBetween, subgraphBetween];
mm = RandomReal[0.5, {10, 10}];
vLabels = {1 -> AGR, 2 -> FIS, 3 -> CO1, 4 -> CO2, 5 -> MA1, 6 -> MA2,
7 -> EGW, 8 -> CST, 9 -> WHS, 10 -> HOT};
selectBetween[\[Theta]1_, \[Theta]2_] := 
BoolEval[\[Theta]1 <= mm <= \[Theta]2];
subgraphBetween[\[Theta]1_, \[Theta]2_] := 
AdjacencyGraph[selectBetween[\[Theta]1, \[Theta]2],
PlotLabel -> \[Theta]1 <= Subscript[m, ij] <= \[Theta]2, 
VertexSize -> 0.3, VertexLabels -> vLabels , ImagePadding -> 20, 
ImageSize -> 150];
Manipulate[
Grid[
{{"Digraph within the range for \!\(\*SubscriptBox[\(m\), \
\(ij\)]\)", 
"Total number of edges in the interval"}, {subgraphBetween[\
\[Theta]1, \[Theta]2], 
EdgeCount[subgraphBetween[\[Theta]1, \[Theta]2]]}} // Transpose
],
{{\[Theta]1, 0.00001, 
"Threshold \[Theta]1 < \!\(\*SubscriptBox[\(m\), \(ij\)]\)"}, 
0.00001, 0.5, 0.01},
{{\[Theta]2, 0.00001, 
"\!\(\*SubscriptBox[\(m\), \(ij\)]\) < Threshold \[Theta]2"}, 
0.00001, 0.5, 0.01}
]

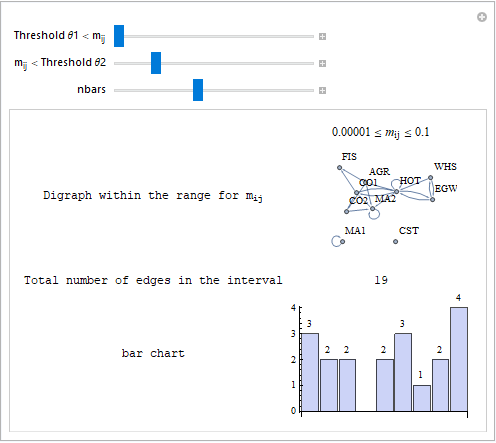
I like to have a histogram of edges in mm in which each ban is defined by a range from theta1 to theta2. I also like to see the number of edges on top of each bar in the histogram so that the reader will immediately see how many edges exist in the relevant bar.

Thank you for your help.

$\endgroup$
2
  • $\begingroup$ We don't use SMS style here. Hope I'm clear. $\endgroup$
    – user64494
    Commented Jun 1, 2019 at 2:36
  • $\begingroup$ @user64494: I do not know what SMS style is. I simply cut and past parts of my Code. This is the way I have been doing until today. $\endgroup$ Commented Jun 1, 2019 at 12:28

1 Answer 1

3
$\begingroup$
Manipulate[Grid[{{"Digraph within the range for " <> 
   ToString[Subscript[m, ij], TraditionalForm], 
  "Total number of edges in the interval",  "bar chart"}, 
 {subgraphBetween[θ1, θ2], EdgeCount[subgraphBetween[θ1, θ2]], 
     BarChart[ec = EdgeCount[subgraphBetween[##]] & @@@ 
        Partition[Range[θ1, θ2, (θ2 - θ1)/nbars], 2, 1], 
         ChartLabels -> Placed[ec, Above]]}} // Transpose], 
 {{θ1, 0.00001, "Threshold θ1 < " <> ToString[Subscript[m, ij], TraditionalForm]},  
   0.00001, 0.5, 0.01}, 
 {{θ2, 0.1, ToString[Subscript[m, ij], TraditionalForm] <> " < Threshold θ2"},  
   θ1 + 0.00001, 0.5, 0.01},
 {{nbars, 5}, 1, 20, 1}]

enter image description here

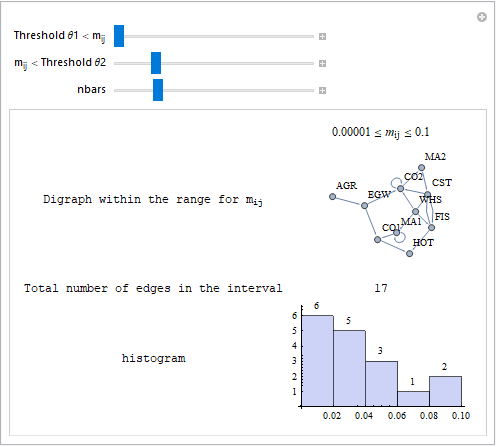
If you have to use Histogram replace BarChart[...] above with

Histogram[{0}, {binlims = Range[θ1, θ2, (θ2 - θ1)/nbars]}, 
  (EdgeCount[subgraphBetween[##]] & @@@ Partition[binlims, 2, 1]&), 
  LabelingFunction -> Above]

to get

enter image description here

$\endgroup$
2
  • $\begingroup$ this is really very very nice. Thank you. $\endgroup$ Commented Jun 1, 2019 at 12:26
  • $\begingroup$ @TugrulTemel, you are welcome. Thank you for the accept. $\endgroup$
    – kglr
    Commented Jun 1, 2019 at 12:44

Your Answer

By clicking “Post Your Answer”, you agree to our terms of service and acknowledge you have read our privacy policy.

Not the answer you're looking for? Browse other questions tagged or ask your own question.