4
$\begingroup$

I have a format issue with my histogram.

First of all my command:

Labeled [Histogram[{data},{Width},"Probability",LabelingFunction->Above,ImageSize->{820,530},PlotRange->All],{Rotate["relative",90 Degree],nameAxisX},{Left,Bottom}]

I have data in the interval [0,1] which I have grouped in classes with Width = 0,1.

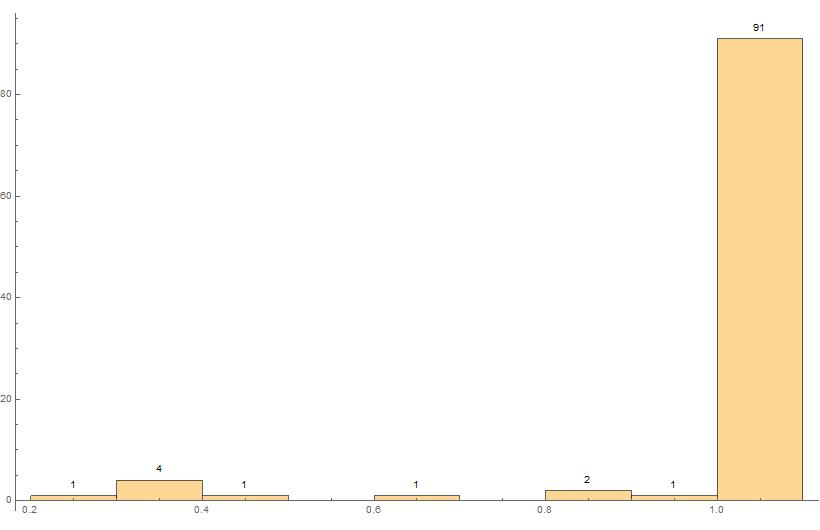
The data are counted correctly. Unfortunately the histogram doesn't start at 0.0 and it extends by 1.0; or - most surely - it is moved to right so that it looks like it is extending.

I have attached my diagramme so that you will see what I am speaking about.

What I would like to have: every bar of the histogram in its own interval from 0.0-0.1, 0.1-0.2, ..., 0.9-1.0.

Thank you.

enter image description here

$\endgroup$
4
  • $\begingroup$ What do you get in return from MinMax[data]? $\endgroup$
    – Jason B.
    Commented Aug 23, 2016 at 18:10
  • $\begingroup$ for min = 0.21 and for max 1. please see that i have just 1. and not 1.0 $\endgroup$ Commented Aug 23, 2016 at 18:19
  • $\begingroup$ I believe the bins are created in the following manner: 0 <= x < 0.1, 0.1 <= x < 0.2, ...., 0.9 <= x < 1, and 1 <= x < 1.1. So all of the 1's go into the rightmost bin. Knocking those 1's down to 0.999 is one way to get the desired histogram. $\endgroup$
    – JimB
    Commented Aug 23, 2016 at 18:22
  • $\begingroup$ oh ok i see that could be the case. yes you are right i have several values with 1. have you a hint to manipulate the series pretty easily to map all the 1.0 down to 0.999...many thanks $\endgroup$ Commented Aug 23, 2016 at 18:28

2 Answers 2

7
$\begingroup$

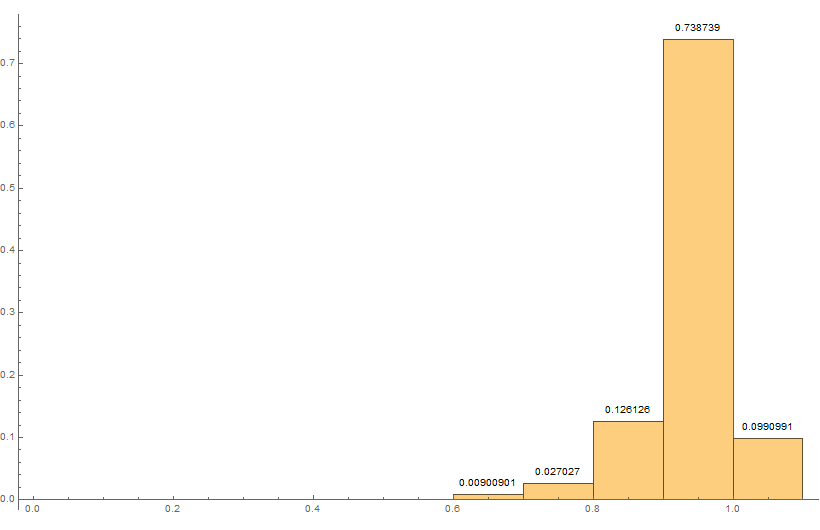
The bins include the left boundary of the bin but not the right boundary. Therefore, in this case the 1's get moved over to a bin to the right of 1.

(* Generate some data from a beta distribution *)
data = RandomVariate[BetaDistribution[10, 0.5], 100];
(* Add some 1's *)
data = Flatten[{data, {1, 1, 1, 1, 1, 1, 1, 1, 1, 1, 1}}];

(* Resulting histogram *)
Labeled[Histogram[data, {0, 1.1, 0.1}, "Probability",
  LabelingFunction -> Above, ImageSize -> {820, 530}, 
  PlotRange -> All],
 {Rotate["relative", 90 Degree], "X"}, {Left, Bottom}]

Original histogram

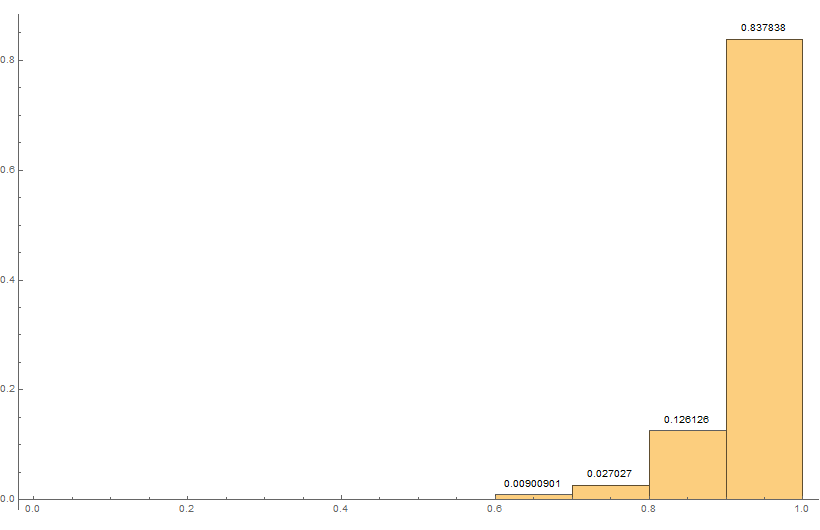
Truncating to something like 0.999 will force all of the 1's into the bin just to the left of 1.0:

Labeled[Histogram[Map[Min[#, 0.999] &, data], {0, 1, 0.1}, 
  "Probability",
  LabelingFunction -> Above, ImageSize -> {820, 530}, 
  PlotRange -> All],
 {Rotate["relative", 90 Degree], "X"}, {Left, Bottom}]

Histogram with ones in the desired bin

$\endgroup$
4
  • $\begingroup$ many thanks. It works perfectly . The MAP-function has been unknown to me $\endgroup$ Commented Aug 23, 2016 at 18:52
  • $\begingroup$ It maps all numbers bigger than 0.999 to 0.999. But that might be a bit dangerous if there are wrong or right numbers bigger than one. If you want just to correct the 1's, then maybe something like Map[If[# == 1, 0.999, #] &, data] would be better. And data /. {1 -> 0.999} works, too. $\endgroup$
    – JimB
    Commented Aug 23, 2016 at 18:52
  • $\begingroup$ Many thanks. The data will NEVER be bigger then 1.0 due this are a similarity coefficient and it the upper bound ist 100% . but i will write down your note to my book to have this all in my mind :) $\endgroup$ Commented Aug 23, 2016 at 19:01
  • 1
    $\begingroup$ Never say never. Things happen. $\endgroup$
    – JimB
    Commented Aug 23, 2016 at 19:08
0
$\begingroup$

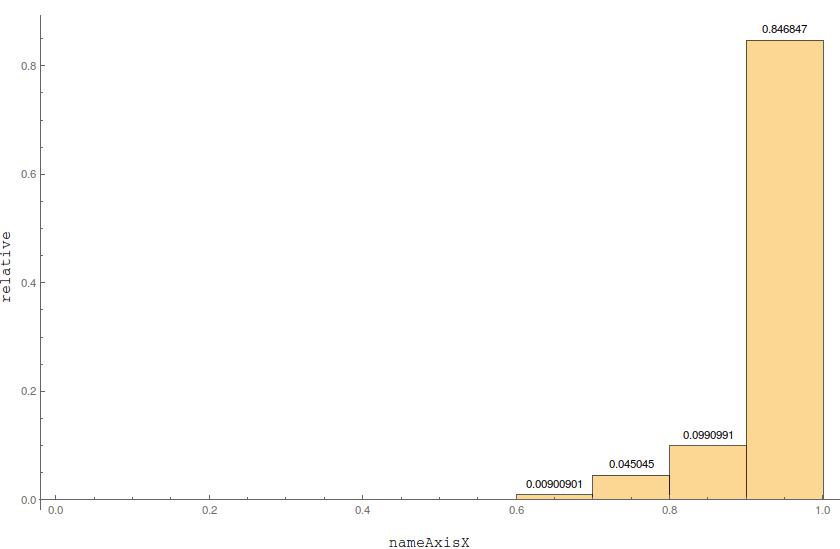
A complementary approach to @Jim Baldwin's answer would be to slightly increase the size of the last bin instead of manipulating the data:

(* Generate some data from a beta distribution *)
data = RandomVariate[BetaDistribution[10, 0.5], 100];
(* Add some 1's *)
data = Flatten[{data, {1, 1, 1, 1, 1, 1, 1, 1, 1, 1, 1}}];

Define the bins (I guess this can be made more elegant, but it's straightforward enough for the current purpose):

Width = Join[Table[i, {i, 0, 0.9, 0.1}], {1.0001}];

Then your plot:

Labeled[Histogram[{data}, {Width}, "Probability", 
  LabelingFunction -> Above, ImageSize -> {820, 530}, 
  PlotRange -> All], {Rotate["relative", 90 Degree], 
  nameAxisX}, {Left, Bottom}]

produces

enter image description here

where the rightmost bins' size is visually undistinguishable from the other ones.

$\endgroup$

Your Answer

By clicking “Post Your Answer”, you agree to our terms of service and acknowledge you have read our privacy policy.

Not the answer you're looking for? Browse other questions tagged or ask your own question.