0
$\begingroup$

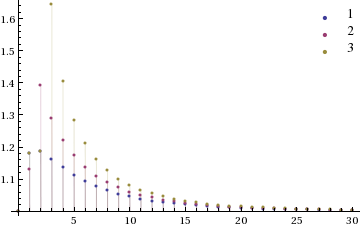
I have found several topics with legend issues but no answer to my problem. I have a function and I need to plot it for integers only (hence discrete plot) and then add a legend too. But PlotLegend does not work, its always red (my code gets red) and does not plot it. I can confirm that it does work when I use Plot instead of DiscretePlot. Nevertheless I need my variable to be positive integer.

function[gh_, ga_] := 
      If[gh == ga, 1 + 0.18^((gh + ga)^0.25), 
       1 + 0.18^((gh - ga)^2)^0.25];

DiscretePlot[{function[0, i]^i, function[0 + 1, i]^i, 
      function[0 + 2, i]^i}, {i, 0, 30}, PlotRange -> Full]

any ideas? I use Mathematica 8.0.0.0.

$\endgroup$
4
  • $\begingroup$ Have you seen this? $\endgroup$
    – Öskå
    Commented Dec 19, 2014 at 15:39
  • $\begingroup$ yes but it seems too complicated for what I needed to do. I cannot understand why I am not allowed to use PlotLegend with discreteplot. Nevertheless thanks for answering! $\endgroup$
    – Fierce82
    Commented Dec 19, 2014 at 15:45
  • $\begingroup$ DiscretePlot[{function[0, i]^i, function[0 + 1, i]^i, function[0 + 2, i]^i}, {i, 0, 30}, PlotRange -> Full, PlotLegends -> {"x", "y", "z"}] works fine in 10.0. $\endgroup$ Commented Dec 19, 2014 at 16:09
  • $\begingroup$ @DavidG.Stork V8 has a very bad legend maker :) $\endgroup$
    – Öskå
    Commented Dec 19, 2014 at 16:12

1 Answer 1

1
$\begingroup$

I voted to close this as a duplicate but since the OP said "it seems too complicated for what I needed to do" here is a way to do it.

Copy the whole code given by Jens and modify the function legendMaker by commenting Line[...] in f:

If[#1 === {None} || (PlotStyle /. {opts}) === None, {}, Line[{{-.1,0}, {.1,0}}]]

should be:

If[#1 === {None} || (PlotStyle /. {opts}) === None, {}, (* Line[{{-.1,0}, {.1,0}} *)]]

You can simply remove the whole line but commenting it allows you to use it afterwards.


Then simply use:

function[gh_, ga_] := If[gh == ga, 1 + 0.18^((gh + ga)^0.25), 1 + 0.18^((gh - ga)^2)^0.25];
p = DiscretePlot[{function[0, i]^i, function[0 + 1, i]^i, function[0 + 2, i]^i}, {i, 0, 30},
  PlotRange -> Full];

opts = Sequence[Background -> Transparent, RoundingRadius -> 10];
Overlay[{p, 
  legendMaker[{"1", "2", "3"}, 
   PlotStyle -> (ColorData[1][#] & /@ Range@3), 
   PlotMarkers -> {\[FilledSmallCircle]}, opts]}, 
 Alignment -> {Right, Top}]

Mathematica graphics

$\endgroup$

Not the answer you're looking for? Browse other questions tagged or ask your own question.