19
$\begingroup$

I have been using ArrayPlot to show off some information. Currently, my datasets are like so:

data1={2, 6, 3, 4, 8, 5, 13, 11, 33, 21, 29, 21, 42, 29, 36};
data2={0, 1, 9, 1, 3, 0, 5, 3, 20, 16, 4, 13, 7, 10, 7};
data3={10, 3, 2, 0, 2, 1, 0, 0, 14, 2, 1, 12, 6, 0, 10};
data4={0, 0, 0, 2, 0, 1, 4, 0, 0, 4, 0, 4, 1, 3, 2};
data5={0, 3, 0, 3, 0, 0, 0, 3, 3, 2, 1, 14, 4, 2, 4};

etc.

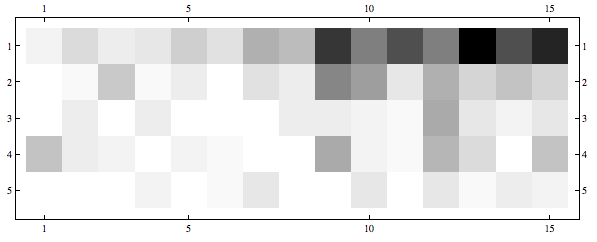
The plot command

ArrayPlot[{globeCHR, starCHR, telegramCHR, gazetteCHR, citizenCHR}, 
 FrameTicks -> All] 

reveals the following:
enter image description here

So far so good - it vividly shows what I am trying to visualize.

The problem comes with the following. I would like to give my datasets along the y axis names: i.e. instead of "1" it might say "Cats" and instead of "2" it might say "Dogs." Similarly, the bottom axis needs to go from 1997 to 2010 (years).

I have generated a list of the years as such yearlist = Range[1997, 2011, 1], which lines up in length to the datasets. Matched pairs of data created by Transpose@ the two lists hasn't worked either..

Would there be a way to have the x axis demonstrate the text of the datasets, and the y axis show the data progressing from the year 1997 to 2010? Thank you very much.

$\endgroup$

1 Answer 1

20
$\begingroup$

The FrameTicks should be entered in the following format:

FrameTicks->{
    {{ytick1, yvalue1}, {ytick2, yvalue2},...}, 
    {{xtick1, xvalue1}, {xtick2, xvalue2},...}
}

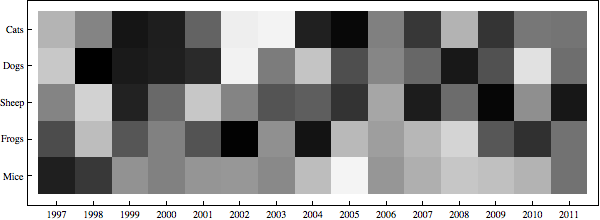
So here's an example for your case that shows how to label the ticks:

xticks = Transpose[{Range@15, Range[1997, 2011]}];
yticks = Transpose[{Range@5, {"Cats", "Dogs", "Sheep", "Frogs", "Mice"}}];
ArrayPlot[RandomReal[1, {5, 15}], FrameTicks -> {yticks, xticks}]

enter image description here

$\endgroup$
1
  • 1
    $\begingroup$ This fails for me if you are doing a 2x2 array, as in ArrayPlot[RandomReal[1, {#1, #2}], FrameTicks -> {yticks[[;; #1]], xticks[[;; #2]]}] &[2, 2]. It works in other cases. As a workaround for the 2x2 case, just add on a junk value for xticks or yticks, it will just ignore the extra. For example, this works ArrayPlot[RandomReal[1, {#1, #2}], FrameTicks -> {yticks, xticks[[;; #2]]}] &[2, 2]. There is probably a better way of doing in though. (yticks and xticks are as defined in your answer). $\endgroup$ Commented Feb 17, 2017 at 16:29

Your Answer

By clicking “Post Your Answer”, you agree to our terms of service and acknowledge you have read our privacy policy.

Not the answer you're looking for? Browse other questions tagged or ask your own question.