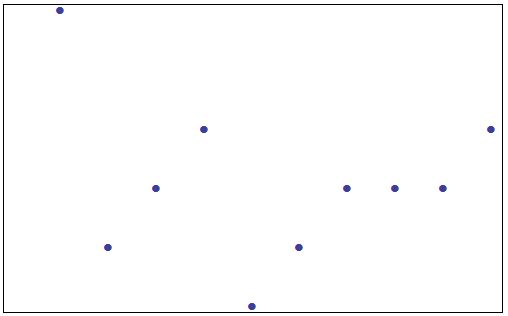
I would like to have a custom ticks on x-axis on my ListPlot, but nothing is showing, what am I doing wrong?
data = {{1, 2}, {2, -2}, {3, -1}, {4, 0}, {5, -3},
 {6, -2}, {7, -1}, {8, -1}, {9, -1}, {10, 0}};

ListPlot[data,
 FrameTicks -> {{"ττ", "τr", "τθ",
    "\τφ", "rr", "rθ", "rφ",
    "θθ", "θφ",
    "φφ"}, {-5, 5}}, Frame -> True,
 PlotMarkers -> {Automatic, Medium}, Axes -> False,ImageSize -> 500]
And I get


FrameTicksandTicksdocumentation? Especially Details section is going to be helpful. $\endgroup$labels = {"\[Tau]\[Tau]", "\[Tau]r", "\[Tau]\[Theta]", "\[Tau]\[CurlyPhi]", "rr", "r\[Theta]", "r\[CurlyPhi]", "\[Theta]\[Theta]", "\[Theta]\[CurlyPhi]", "\[CurlyPhi]\[CurlyPhi]"}; ticks = Table[x, {x, 0, 9}]; frameticks = Transpose[{ticks, labels}]then set the optionFrameTicks -> {{False, False}, {frameticks, False}}$\endgroup$FramTicksdetails:"For each edge, tick marks can be specified as described in the notes for Ticks.". And as it is written, inTicksdocumentation there are examples how the proper syntax with labels looks. $\endgroup$