13
$\begingroup$

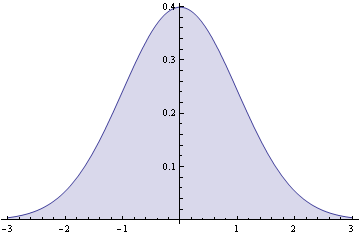
I have a standard normal curve rendered with the following command:

Plot[{1/Sqrt[2*Pi] Exp[-1/2*x^2]}, {x, -3, 3}, Filling -> Axis]

It looks exactly as you think it would:

enter image description here

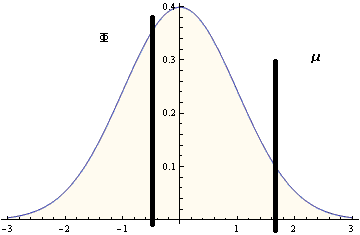
I want to be able to put an "insert" in. Like a line that would be displayed on top of the curve for specific points. Namely for the sample mean value in relation to the curve. With my (limited) editing skills in mspaint, here's an example:

enter image description here

Does anybody know how this could be accomplished?

$\endgroup$
6
  • 2
    $\begingroup$ Did you have a look at the GridLines option of Plot[]? $\endgroup$ Commented Apr 17, 2012 at 17:03
  • 2
    $\begingroup$ Alternatively: look into Epilog and the graphics primitives Line[] and Text[]... $\endgroup$ Commented Apr 17, 2012 at 17:04
  • 6
    $\begingroup$ And did you know that instead of MS Paint, you can also use the drawing tools provided by Mathematica: click on the graphic and select the menu item Graphics > Drawing Tools. $\endgroup$
    – Jens
    Commented Apr 17, 2012 at 17:16
  • $\begingroup$ Eiplog is working by the way! thanks! the problem with the example used in the mathematica documentation concerning epilog, found here reference.wolfram.com/mathematica/ref/Line.html is that the function Line[] is for a continuous selection of data points. I want two discrete unjoined lines. Any idea how that could be accomplished? thanks! $\endgroup$
    – user582
    Commented Apr 17, 2012 at 17:36
  • 4
    $\begingroup$ @franklin You can provide a list of graphics primitives to Epilog, e.g. Epilog -> {Line[{pt1, pt2}], Line[{pt3, pt4}]} would draw two unconnected lines. Even with one Line statement you can draw unconnected lines by doing something like Line[{{pt1, pt2}, {pt3, pt4}}]. $\endgroup$
    – Heike
    Commented Apr 17, 2012 at 17:43

2 Answers 2

18
$\begingroup$

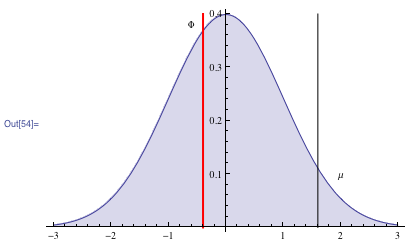
You can display graphics primitives in your plot by using the Show command

Show[
  Plot[{1/Sqrt[2*Pi] Exp[-1/2*x^2]}, {x, -3, 3}, Filling -> Axis],
  Graphics[Line[{{1.6, 0}, {1.6, 0.4}}]],
  Graphics[{Thick, Red, Line[{{-0.4, 0}, {-0.4, 0.4}}]}],
  Graphics[Text["Φ", {-.6, 0.38}]],
  Graphics[Text["μ", {2, 0.1}]]
]

You can actually just combine all the Graphics objects into one list but I always keep them separate for legibility and editability since otherwise you have to remember to switch back and forth between e.g. color and line weight specifications.

Show[
  Plot[{1/Sqrt[2*Pi] Exp[-1/2*x^2]}, {x, -3, 3}, Filling -> Axis],
  Graphics[
     {Line[{{1.6, 0}, {1.6, 0.4}}],
      Thick, Red,
      Line[{{-0.4, 0}, {-0.4, 0.4}}],
      Thin, Black,
      Text["Φ", {-.6, 0.38}],
      Text["μ", {2, 0.1}]}
  ]
]
enter image description here

You can also achieve the same result by using the Epilog or Prolog option for Plot

Plot[
  {1/Sqrt[2*Pi] Exp[-1/2*x^2]}, 
  {x, -3, 3}, 
  Filling -> Axis, 
  Prolog ->
    {Line[{{1.6, 0}, {1.6, 0.4}}],
    Thick, Red,
    Line[{{-0.4, 0}, {-0.4, 0.4}}],
    Thin, Black,
    Text["Φ", {-.6, 0.38}],
    Text["μ", {2, 0.1}]}
]

The difference between Prolog and Epilog is in placing your graphics primitives behind or in front of the Plot, this may be important in certain circumstances.

Once you have composed your plot you can use the standard Export command to save it to a format of your choosing.
$\endgroup$
3
  • $\begingroup$ Just for reference on "behind or on top of", see this issue: Prolog is put on top of GridLines. $\endgroup$ Commented Apr 17, 2012 at 18:35
  • 3
    $\begingroup$ @IstvánZachar Perhaps you can try using the undocumented option Method -> {"GridLinesInFront" -> True} $\endgroup$
    – rm -rf
    Commented Apr 17, 2012 at 18:52
  • 1
    $\begingroup$ You can also use sublists to restrict graphics directives to only part of the graphics objects: Graphics[{Line[{{1.6, 0}, {1.6, 0.4}}],{Thick, Red, Line[{{-0.4, 0}, {-0.4, 0.4}}]},Text["\[CapitalPhi]", {-.6, 0.38}],Text["\[Mu]", {2, 0.1}]] $\endgroup$
    – celtschk
    Commented Apr 17, 2012 at 18:55
2
$\begingroup$

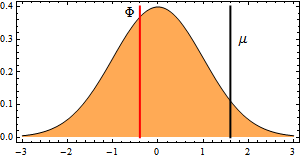
I thought I would show how to do this with Presentations (which I sell). It is not necessary to use Show and Graphics level jumping (the repeated Graphics wrappers on primitives) or the Epilog option. Say what you wish, these are confusing to many users. Here everything is a primitive and one just draws one thing after another.

<< Presentations` 

Draw2D[
 {Draw[{1/Sqrt[2*Pi] Exp[-1/2*x^2]}, {x, -3, 3}, Filling -> Axis, 
   FillingStyle -> Lighter@Orange],
  Thick,
  Line[{{1.6, 0}, {1.6, 0.4}}],
  {Red, Line[{{-0.4, 0}, {-0.4, 0.4}}]},
  Text[Style["\[CapitalPhi]", 14], {-0.6, 0.38}],
  Text[Style["\[Mu]", 14], {1.9, 0.3}]},
 AspectRatio -> 1/2,
 Frame -> True,
 ImageSize -> 300]

enter image description here

$\endgroup$

Your Answer

By clicking “Post Your Answer”, you agree to our terms of service and acknowledge you have read our privacy policy.