22
$\begingroup$

I'm creating figures (a T beam section) using the Graphics function. Like this:

a = Graphics[Polygon[{{0, 80}, {0, 85}, {100, 85}, {100, 80}}]];
b = Graphics[Polygon[{{47.5, 80}, {52.5, 80}, {52.5, 0}, {47.5, 0}}]];
Show[a, b]

Which gives:

enter image description here

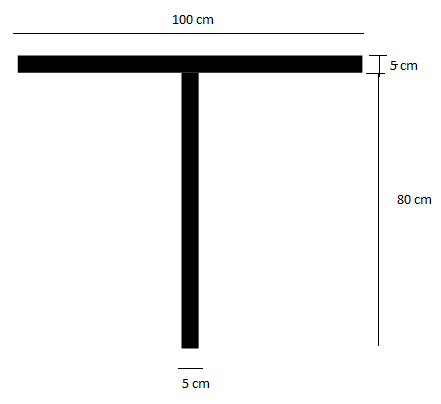
I need to insert numerical dimensions to its sizes. I need something like this:

enter image description here

How can i do that?

$\endgroup$
1
  • $\begingroup$ No SolidWorks é muito mais fácil. Só um comentário... $\endgroup$
    – LCarvalho
    Commented Nov 25, 2017 at 3:13

3 Answers 3

33
$\begingroup$

You could turn the dimensioning into a handy function:

ClearAll@dim;
dim[{a_, b_}, label_String, d_] :=
  Module[{n = Normalize[RotationTransform[π/2][b - a]], 
    t = Arg[(b - a).{1, I}], r},
   If[t > π/2, t -= π];
   {
    Arrowheads[{-0.04, 0.04}],
    Arrow[{a + d n, b + d n}],
    Line[{a + 0.1 d n, a + d n}], Line[{b + 0.1 d n, b + d n}],
    Rotate[Text[label, (a + b)/2 + 1.2 d n, {0, 0}], 
     t, (a + b)/2 + 1.2 d n]
    }];

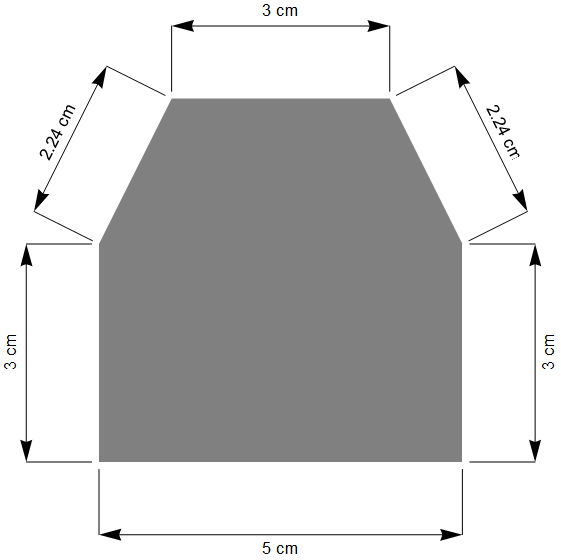
An example:

Graphics[{
  {Gray, Rectangle[{0, 0}, {5, 3}], 
   Polygon[{{0, 3}, {5, 3}, {4, 5}, {1, 5}}]},
  dim[{{0, 0}, {5, 0}}, "5 cm", -1],
  dim[{{5, 0}, {5, 3}}, "3 cm", -1],
  dim[{{5, 3}, {4, 5}}, "2.24 cm", -1],
  dim[{{1, 5}, {4, 5}}, "3 cm", 1],
  dim[{{0, 3}, {1, 5}}, "2.24 cm", 1],
  dim[{{0, 0}, {0, 3}}, "3 cm", 1]
  }]

1

EDIT:

This seems to have garnered a bit of attention, so I might tidy up a couple of aspects.

ClearAll@dim;
dim[{a_, b_}, d_, round_:1] := Module[{
    n = Normalize[RotationTransform[π/2][b - a]], 
    t = Arg[(b - a).{1, I}], text},
   text = ToString@Round[Norm[a - b], round];
   If[d < 0, text = "\n" <> text, text = text <> "\n"];
   {Arrowheads[{-0.04, 0.04}], Arrow[{a + d n, b + d n}], 
    Line[{a + 0.1 d n, a + d n}], Line[{b + 0.1 d n, b + d n}], 
    Rotate[Text[text, (a + b)/2 + d n, {0, 0}], t, (a + b)/2 + d n]}];

This version has much better positioning of the labels. The previous version had a scale factor based on the distance $d$. The further out it was, the further away from the dimension line. This version uses a newline \n to position the text consistently across any distance.

This version also automatically calculates the distance for you, instead of a user supplied label. The distance can be optionally rounded to whatever accuracy required. One could chop, change and combine label generation as required.

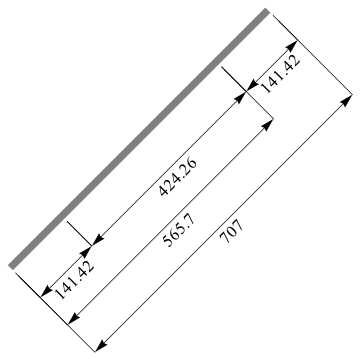
An example with labels at various distances:

Graphics[{{Gray, Polygon[{{0, 0}, {500, 500}, {490, 510}, {-10, 10}}]},
  dim[{{0, 0}, {100, 100}}, -75, 0.01],
  dim[{{100, 100}, {400, 400}}, -75, 0.01],
  dim[{{400, 400}, {500, 500}}, -75, 0.01],
  dim[{{0, 0}, {400, 400}}, -150, 0.1],
  dim[{{0, 0}, {500, 500}}, -225]
  }]

2

$\endgroup$
13
$\begingroup$

Here is my attempt:

rectangles = 
  Graphics[{GrayLevel[.4, .3], Rectangle[{0, 80}, {100, 100}], 
    GrayLevel[.4, .3], Rectangle[{40, 0}, {60, 80}]}];
arrows = Graphics[{Arrow[{{40, -5}, {60, -5}}], 
    Arrow[{{60, -5}, {40, -5}}],
    Arrow[{{105, 0}, {105, 80}}], Arrow[{{105, 80}, {105, 0}}],
    Arrow[{{105, 80}, {105, 100}}], Arrow[{{105, 100}, {105, 80}}],
    Arrow[{{0, 105}, {100, 105}}], Arrow[{{100, 105}, {0, 105}}]}];
text = Graphics[{Text[Style["10 cm", 15], {50, -10}], 
    Text[Style["80 cm", 15], {110, 50}, {0, 0}, Automatic, {0, 1}], 
    Text[Style["10 cm", 15], {110, 90}, {0, 0}, Automatic, {0, 1}], 
    Text[Style["100 cm", 15], {50, 110}]}];
fig = Show[rectangles, arrows, text]
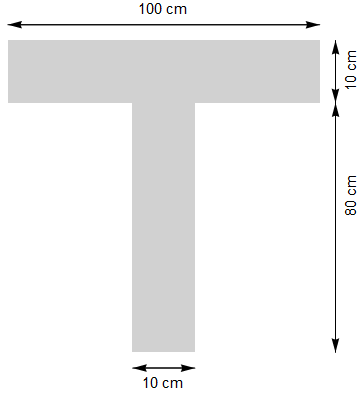
enter image description here

rectangles = 
  Graphics[{GrayLevel[.4, .3], Rectangle[{0, 0}, {5, 15}], 
    GrayLevel[.4, .3], Rectangle[{5, 0}, {30, 5}], GrayLevel[.4, .3], 
    Rectangle[{30, 0}, {35, 15}]}];
lines = Graphics[{Line[{{0, 0}, {0, -2.5}}], 
    Line[{{5, 0}, {5, -2.5}}], Line[{{30, 0}, {30, -2.5}}], 
    Line[{{35, 0}, {35, -2.5}}],
    Line[{{0, 0}, {-2.5, 0}}], Line[{{0, 15}, {-2.5, 15}}],
    Line[{{0, 5}, {-2.5, 5}}]}];
arrows = Graphics[{Arrow[{{5, -2}, {30, -2}}], 
    Arrow[{{30, -2}, {5, -2}}], Arrow[{{30, -2}, {5, -2}}], 
    Arrow[{{0, -2}, {5, -2}}], Arrow[{{5, -2}, {0, -2}}],
    Arrow[{{30, -2}, {35, -2}}], Arrow[{{35, -2}, {30, -2}}],
    Arrow[{{-2, 0}, {-2, 5}}], Arrow[{{-2, 5}, {-2, 0}}],
    Arrow[{{-2, 5}, {-2, 15}}], Arrow[{{-2, 15}, {-2, 5}}]}];
text = Graphics[{Text[Style["5 cm", 15], {2.5, -4}], 
    Text[Style["25 cm", 15], {17.5, -4}], 
    Text[Style["5 cm", 15], {32.5, -4}],
    Text[Style["5 cm", 15], {-4, 2.5}, {0, 0}, Automatic, {0, 1}],
    Text[Style["10 cm", 15], {-4, 10}, {0, 0}, Automatic, {0, 1}]
    }
   ];

Show[rectangles, lines, arrows, text]
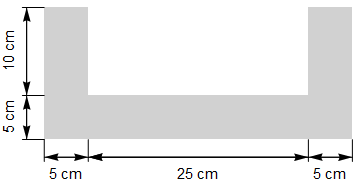
enter image description here

$\endgroup$
4
$\begingroup$
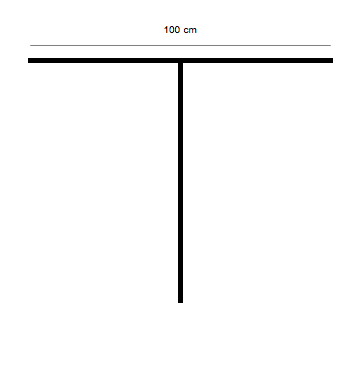
Graphics[
   {AbsoluteThickness[5], 
      Line[{{0, 0}, {100, 0}}],
      Line[{{50, -80}, {50, 0}}],
  AbsoluteThickness[.5],
      Line[{{0, 5}, {100, 5}}],
  Text[Style["100 cm"], {50, 10}]},
 PlotRange -> {{-10, 110}, {-110, 20}}]

enter image description here

I'll let you put in the remaining annotation lines.

$\endgroup$

Your Answer

By clicking “Post Your Answer”, you agree to our terms of service and acknowledge you have read our privacy policy.

Not the answer you're looking for? Browse other questions tagged or ask your own question.