Changed title, removed statistics tag
Source Link
István Zachar
  • 47.2k
  • 20
  • 145
  • 293

How to insert graphics with mathematicaprimitives into a plot?

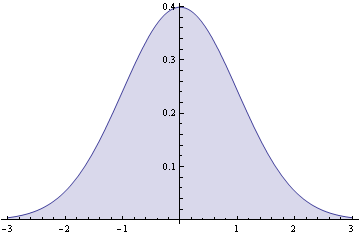
I have a standard normal curve rendered with the following command:

Plot[{1/Sqrt[2*Pi] Exp[-1/2*x^2]}, {x, -3, 3}, Filling -> Axis]

It looks exactly as you think it would:
enter image description here

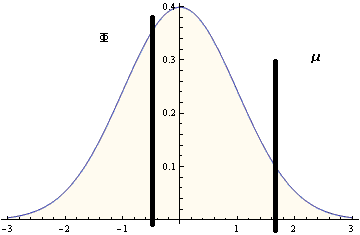
I want to be able to put an "insert" in. Like a line that would be displayed on top of the curve for specific points. Namely for the sample mean value in relation to the cruvecurve. With my (limited) editing skills in mspaint, here's an example:
enter image description here

Does anybody know how this could be accomplished?

graphics with mathematica

I have a standard normal curve rendered with the following command:

Plot[{1/Sqrt[2*Pi] Exp[-1/2*x^2]}, {x, -3, 3}, Filling -> Axis]

It looks exactly as you think it would:

enter image description here

I want to be able to put an "insert" in. Like a line that would be displayed on top of the curve for specific points. Namely for the sample mean value in relation to the cruve. With my (limited) editing skills in mspaint, here's an example:

enter image description here

Does anybody know how this could be accomplished?

How to insert graphics primitives into a plot?

I have a standard normal curve rendered with the following command:

Plot[{1/Sqrt[2*Pi] Exp[-1/2*x^2]}, {x, -3, 3}, Filling -> Axis]

It looks exactly as you think it would:

enter image description here

I want to be able to put an "insert" in. Like a line that would be displayed on top of the curve for specific points. Namely for the sample mean value in relation to the curve. With my (limited) editing skills in mspaint, here's an example:

enter image description here

Does anybody know how this could be accomplished?

Source Link
user582
user582

graphics with mathematica

I have a standard normal curve rendered with the following command:

Plot[{1/Sqrt[2*Pi] Exp[-1/2*x^2]}, {x, -3, 3}, Filling -> Axis]

It looks exactly as you think it would:

enter image description here

I want to be able to put an "insert" in. Like a line that would be displayed on top of the curve for specific points. Namely for the sample mean value in relation to the cruve. With my (limited) editing skills in mspaint, here's an example:

enter image description here

Does anybody know how this could be accomplished?