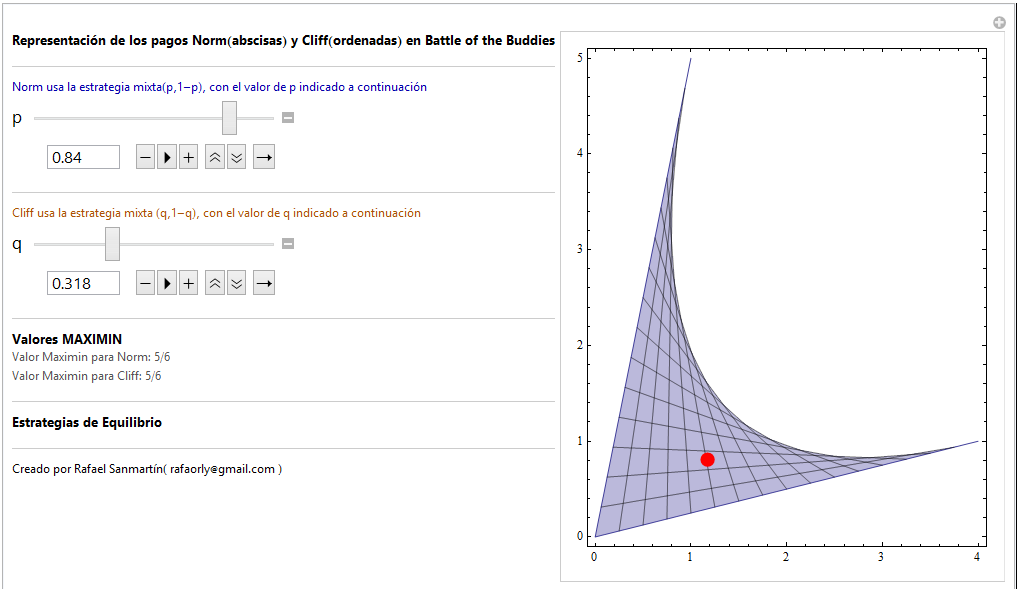
I´m analizyng the game "Battle of the Buddies" similar to "Prisioner´s Dilenma"
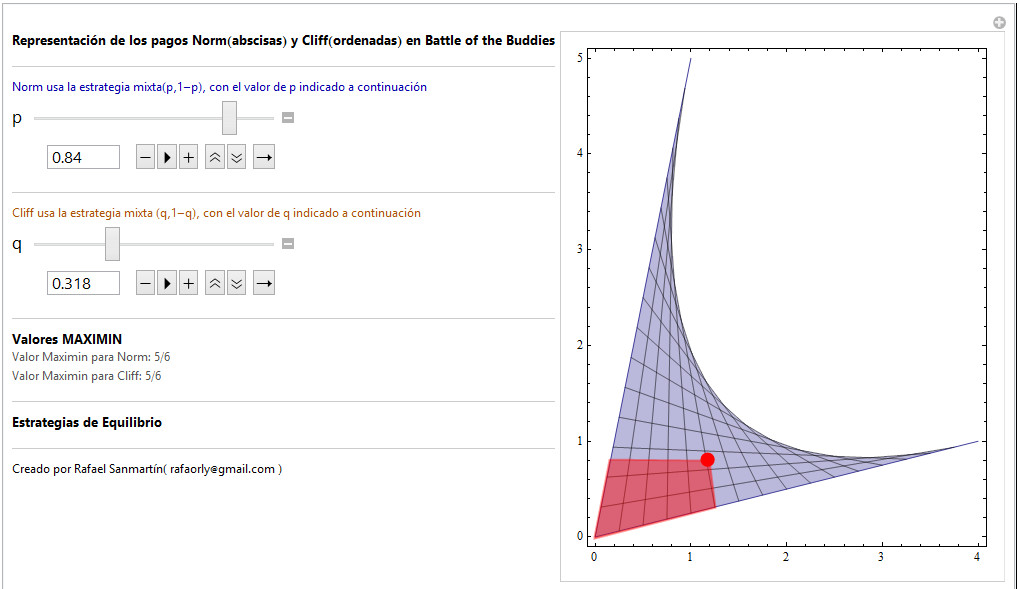
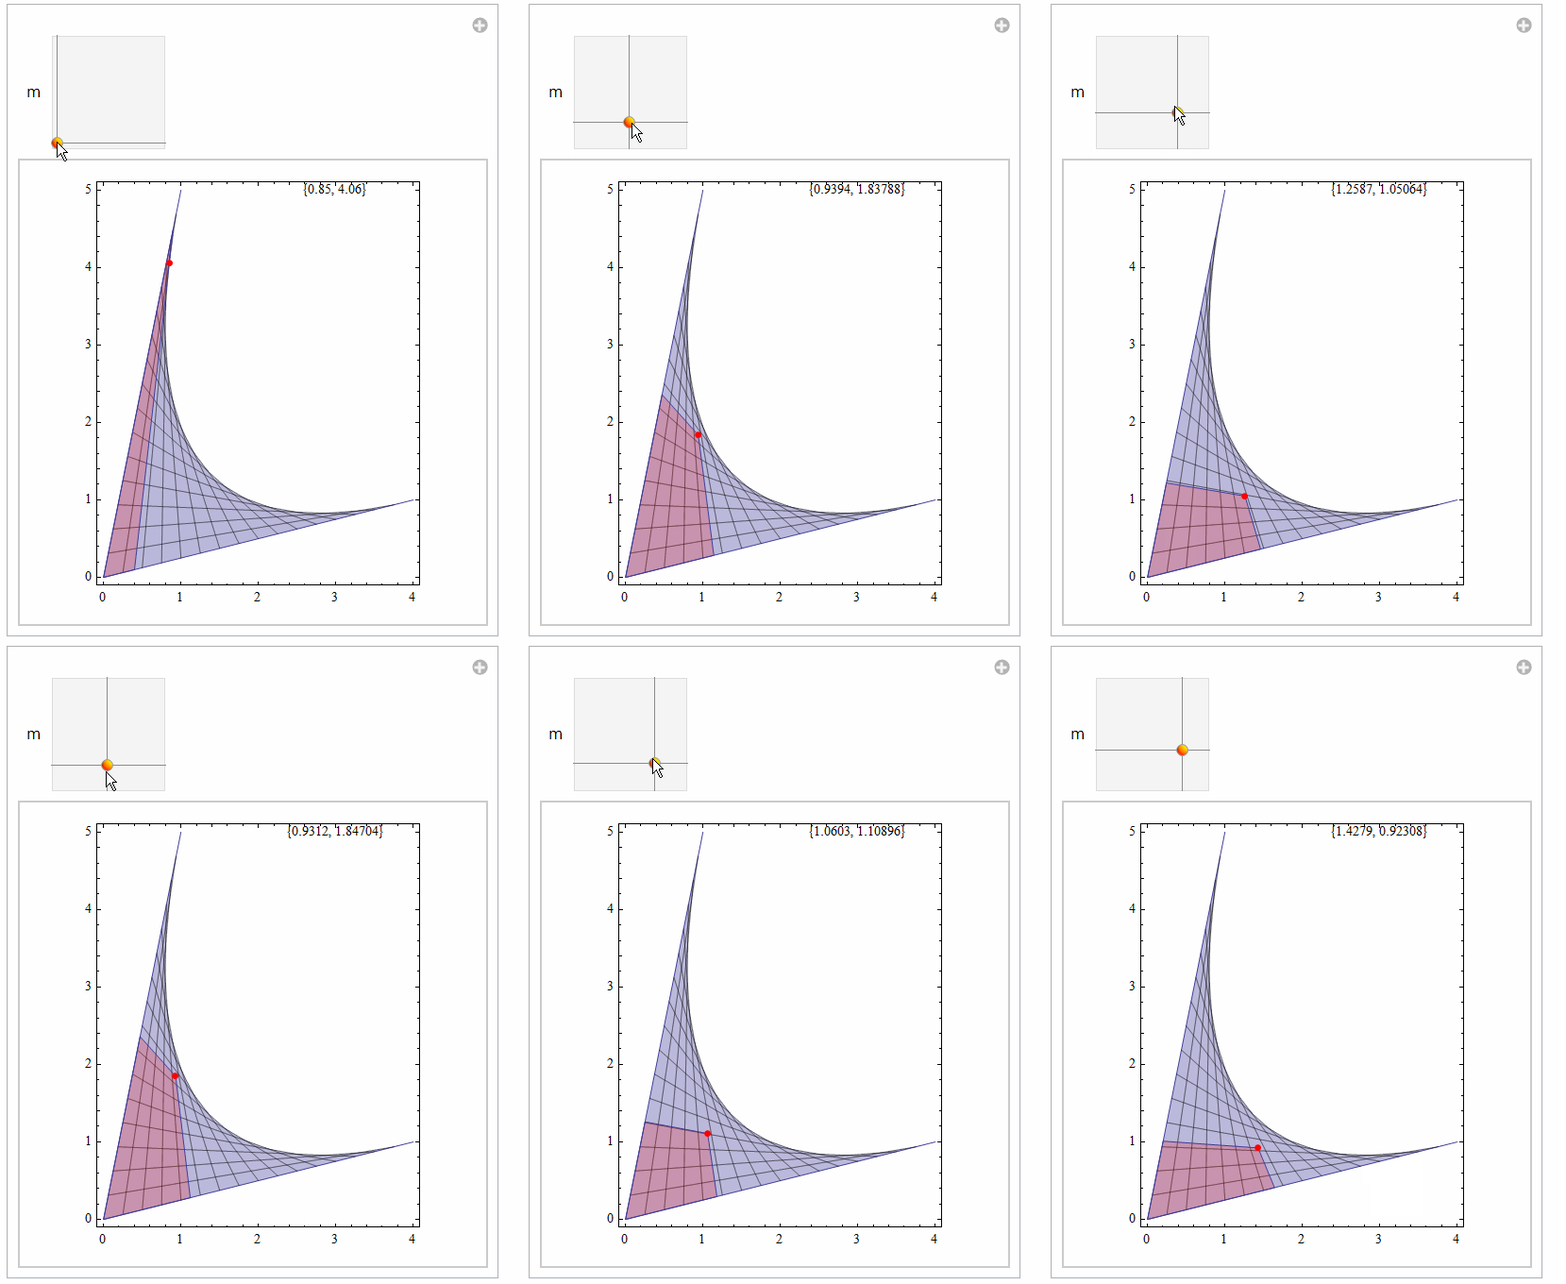
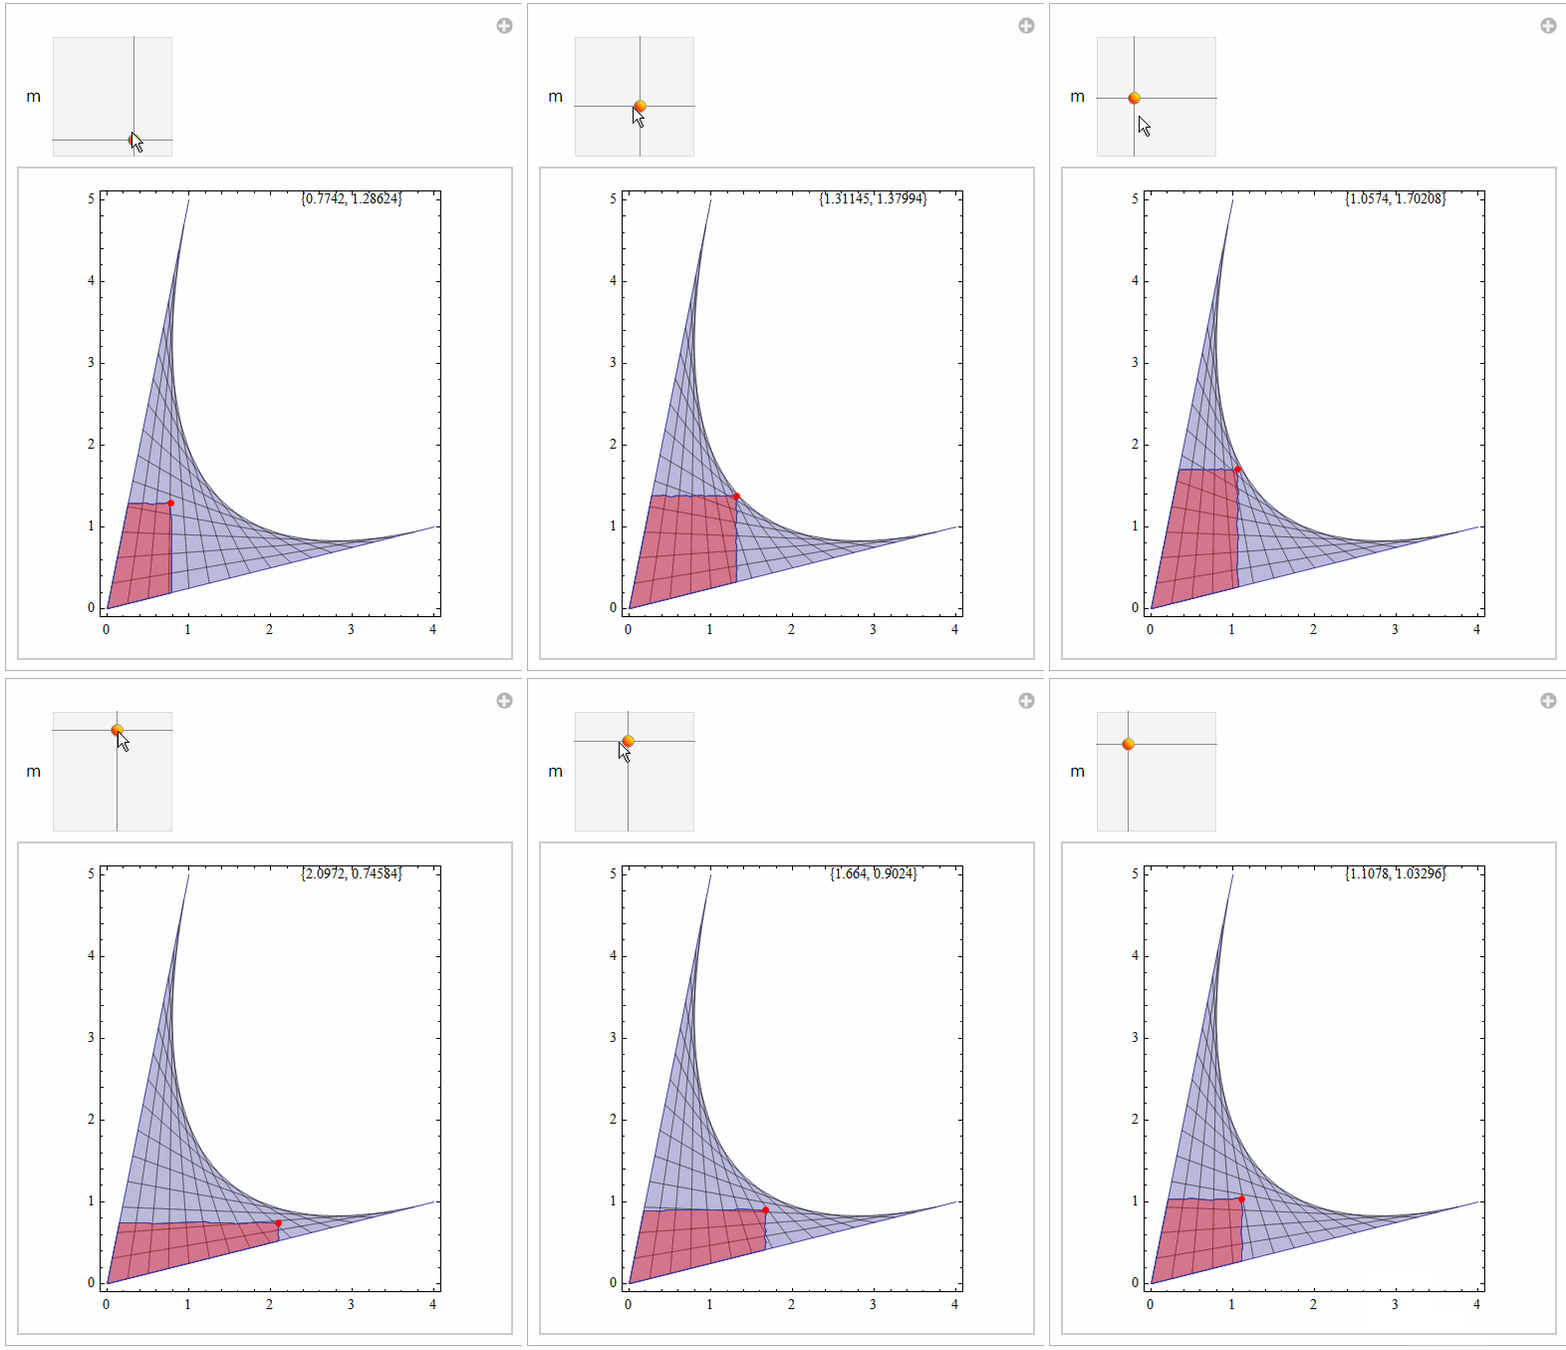
All works fine, BUT... I want to draw in red the point whose coordinates are less than the coords of a strategy.
Manipulate[

 ParametricPlot[{5* x*y - x - y + 1, 6*x*y - 5 x - 5 y + 5}, {x, 0,
   1}, {y, 0, 1}, PerformanceGoal -> "Quality",

  Epilog -> {Red, PointSize -> .036,
    Point[{5* p*q - p - q + 1, 6*p*q - 5 p - 5 q + 5}]}],
 (*ParametricPlot[{5* \
x*y-x-y+1,6*x*y-5x-5y+5},{x,0,1},{y,0,1},PerformanceGoal->"Quality",*)
\


 Style["Representación de los pagos Norm(abscisas) y Cliff(ordenadas) \
en Battle of the Buddies", 11, Bold],
 Delimiter,

 Style["Norm usa la estrategia mixta(p,1-p), con el valor de p \
indicado a continuación", 10, Darker@Blue],
 {{p, 0}, 0, 1, Appearance -> "Open"},
 Delimiter,

 Style["Cliff usa la estrategia mixta (q,1-q), con el valor de q \
indicado a continuación", 10, Darker@Orange],
 {{q, 0}, 0, 1, Appearance -> "Open"},
 Delimiter,

 Style["Valores MAXIMIN", 11, Bold, Darker@Black],
 Style["Valor Maximin para Norm: 5/6", 10, Darker@Gray],
 Style["Valor Maximin para Cliff: 5/6", 10, Darker@Gray],

 Delimiter,
 Style["Estrategias de Equilibrio", 11, Bold, Darker@Black],
 Delimiter,
 Style["Creado por Mika Ike ([email protected])", 10,
  Darker@Black],

 ControlPlacement -> Left, SaveDefinitions -> True

 ]
I can view this

BUT I want to view this.... and I can´t coding that. (Highlighting the set in red)


