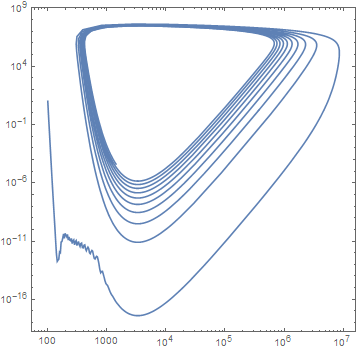
So, basically I'm trying to plot the phase portrait of a 2x2 diff system, but the parameters are a pain. I'm trying to get a good picture of the orbits, but even if I use FrameTicks, Mathematica just ignores me.
So this is the code:
Clear[n1, n2, i, L]

system4 = {D[n1[t], t] == (r1*n1[t])*(1 - (n1[t]/(k1 + L[t])) -
                ((α12*n2[t])/(k1 + L[t]))) - (c1*i[t]*n1[t]),
           D[n2[t], t] == (r2*n2[t])*(1 - (n2[t]/k2) - ((α21*n1[t])/k2)),
           D[i[t], t] == s - (d1*i[t]) + ((ρ*i[t]*n1[t])/(γ + n1[t])) -
                (c2*i[t]*n1[t]),
           D[L[t], t] == (σ*L[t]) + (ϕ*n1[t]) - (ω*n1[t]*L[t])};

L[t_] = 0; ϕ = 0;

n2[t_] = 10^12;

system2 = Table[system4[[m]], {m, {1, 3}}];

incognitas2 = {n1[t], i[t]};

incognitas4 = {n1[t], n2[t], i[t], L[t]};

ci2 = {n1[0] == 100, i[0] == 10};

r1 = 10^(-2);

k1 = 10^(8);

α12 = 9*(10^(-5));

c1 = 10^(-9);

r2 = 10^(-3);

k2 = 10^(12);

α21 = 9*(10^(-2));

s = 0;

d1 = .2;

γ = 100;

c2 = 10^(-10);

ρ = .206;

tfinal = 10000000;

Module[{c = 0},
      sol = NDSolve[Join[system2, ci2], incognitas2, {t, 0, tfinal},
      MaxSteps -> Infinity, Method -> {StiffnessSwitching,
      Method -> {ExplicitRungeKutta, Automatic}}, PrecisionGoal -> 15,
      StepMonitor :> c++]; c];

sol1[t_] = First[n1[t] /. sol];

sol2[t_] = First[i[t] /. sol];
And I want to plot sol2 vs sol1; Axes from 0 to 10^7, pref using the ticks 0,10,10^2,..10^5,10^6,10^7, and both sol1 and sol2 depend on t, I want to run t form 0 to 100 000.
Do you have any suggestions ?

