First of all, I'd say thank you very much to bring such an interesting function to me! I played around with it awhile and came up with the following thought, which I hope would be helpful for you.
About your first question, I'm sorry I know nothing concrete but only some guessing.
1. Aspect Ratio
I think FullGraphics uses the actual coordinates to calculate aspect-ratio (like setting AspectRatio->Automatic in Plot), so you may need to stretch the origin graphics g before feeding it to FullGraphics.
g = Plot[Sin[x], {x, 0, 10}]
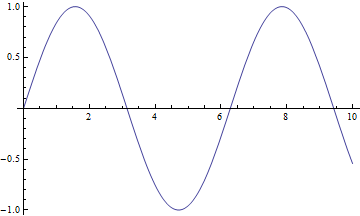
Setting AspectRatio doesn't really affect the result:
FullGraphics /@ {g, Show[g, AspectRatio -> RandomReal[]]} // Column
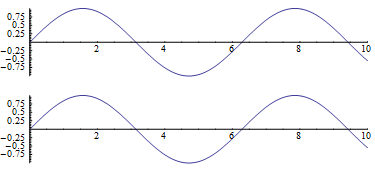
2. Position of Ticks
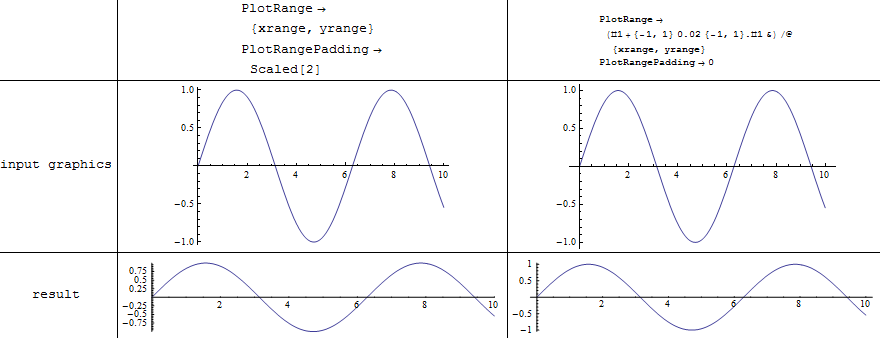
And it seems, if Ticks was set to Automatic in the input g, FullGraphics generates ticks positions with flavor that Plot does with PlotRangePadding->0, which will affect the automatic ticks generation if PlotRange is set to Automatic(i.e. the default setting).
the PlotRange of g:
{xrange, yrange} = PlotRange /. AbsoluteOptions[g, PlotRange]
Compare two kinds of settings, where the right side column merged the original PlotRangePadding space into PlotRange:
3. Length of Tick-marks
About the lengths of tick marks, it looks for me like the default style in old Mathematica versions (like 4.x), so my personal guess would be, maybe it was just forgotten to be adjusted to new default style.
About your second question
So here is my homemade brute-force method:
Clear[labelFmtFunc]
labelFmtFunc[label_] :=
 If[label === "", "",
  If[FractionalPart[label] == 0, Round[label], label]]

Clear[ticksStretchFunc]
ticksStretchFunc[ticksetting_, xrange_, yrange_, stretchRatio_,
  factor_: 2] := Module[{xTicksetting, yTicksetting},
  xTicksetting =
   ticksetting[[
     1]] /. {pos_, label_, {plen_, nlen_}, style_} :> {pos,
      labelFmtFunc[label], factor {plen, nlen}, style};
  yTicksetting =
   ticksetting[[
     2]] /. {pos_, label_, {plen_, nlen_},
      style_} :> {stretchRatio pos, labelFmtFunc[label],
      factor {plen, nlen}, style};
  {xTicksetting, yTicksetting}
  ]

Clear[myFullGraphics]
myFullGraphics[g_Graphics, tickLengthFactor_: 2] :=
 Module[{xrange, yrange, stretchRatio, padding, newxrange, newyrange,
   newg, ticksetting},
  {xrange, yrange} = PlotRange /. AbsoluteOptions[g, PlotRange];
  stretchRatio =
   AspectRatio {-1, 1}.xrange/{-1, 1}.yrange /.
    AbsoluteOptions[g, AspectRatio];
  padding = PlotRangePadding /. AbsoluteOptions[g, PlotRangePadding];
  {newxrange, newyrange} =
   MapThread[#1 + {-1, 1} If[
        Head[#2] === Scaled, #2[[1]] {-1, 1}.#1, #2] &, {{xrange,
      yrange}, padding}];
  newg = Show[g, PlotRange -> {newxrange, newyrange}];
  ticksetting = Ticks /. AbsoluteOptions[newg, Ticks];
  Show[If[Head[newg[[1]]] === GraphicsComplex,
     newg /.
      GraphicsComplex[pts_, others__] :>
       GraphicsComplex[
        pts /. {x_?NumericQ, y_?NumericQ} :> {x, stretchRatio y},
        others],
     newg /.
      Line[pts__] :>
       Line[pts /. {x_?NumericQ, y_?NumericQ} :> {x, stretchRatio y}]],
    Ticks ->
     ticksStretchFunc[ticksetting, xrange, yrange, stretchRatio,
      tickLengthFactor],
    PlotRange -> {newxrange, stretchRatio newyrange},
    PlotRangePadding -> 0] // FullGraphics
  ]
Apply it on g:
myFullGraphics[g]
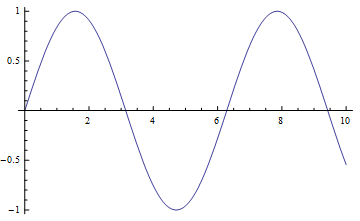
So it's fairly consistent with the original g obtained by Plot.
Applications
myFullGraphics can be used to convert lots (though not all and not always perfectly) of 2D graphics, including those from ContourPlot, into full graphics. The following demonstrates a simple application.
Here is a Graphics object obtained by myFullGraphics:
fullg = PolarPlot[Sin[2 \[Theta] + 2 10^15], {\[Theta], 0, 8 Pi},
   WorkingPrecision -> MachinePrecision,
   PlotRange -> {{-1.1, 1.1}, {-1.1, 1.1}},
   PlotRangePadding -> {Scaled[.02], Scaled[.02]}] //
  myFullGraphics[#, 30] &
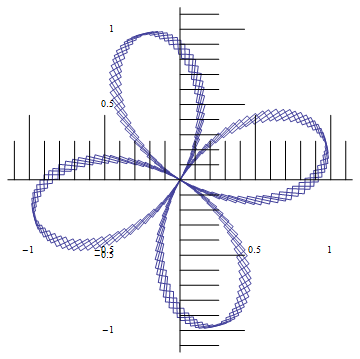
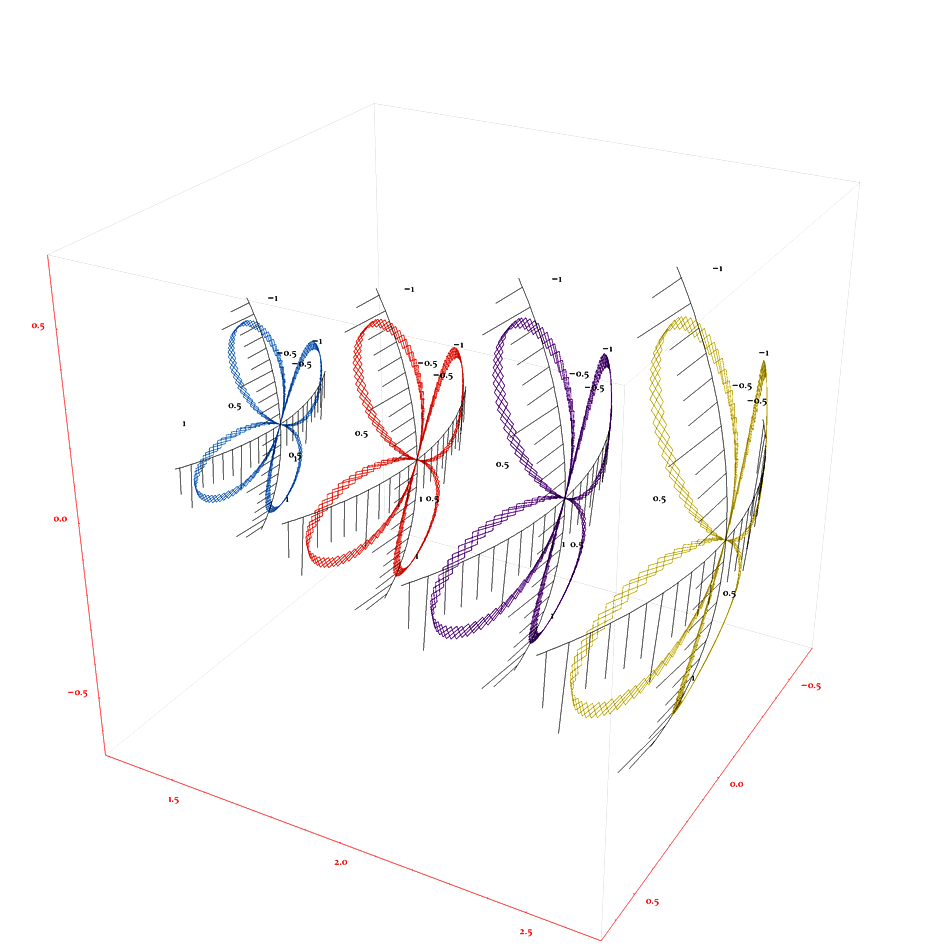
We map it onto the surfaces of several ellipsoids (note the axesRules, I manually converted the axes lines which contains only two endpoints into a line with more points):
Map[With[{range = PlotRange /. AbsoluteOptions[fullg, PlotRange],
     uShift = 0, vShift = 0, rShift = #},
    Clear[transFunc];
    transFunc[{x_?NumericQ, y_?NumericQ}] := Module[{u, v},
      u = Rescale[x, range[[1]], \[Pi]/9 {-1, 1} + uShift];
      v = Rescale[y, range[[2]], \[Pi]/2 + \[Pi]/9 {-1, 1} + vShift];
      rShift {Sin[u] Sin[v], 1.4 Cos[u] Sin[v], Cos[v]}
      ];
    Module[{graphComplexTemp, axesRules},
     axesRules = {SortBy[
          Cases[fullg, Line[{{_, y_}, {_, y_}}], \[Infinity]],
          Abs[{-1, 1}.#[[1, All, 1]]] &][[-1]] /.
        Line[{{x1_, y_}, {x2_, y_}}] :> (Line[{{x1, y}, {x2, y}}] ->
           Line[{#, y} & /@ Range[x1, x2, (x2 - x1)/100]]),
       SortBy[Cases[fullg, Line[{{x_, _}, {x_, _}}], \[Infinity]],
          Abs[{-1, 1}.#[[1, All, 2]]] &][[-1]] /.
        Line[{{x_, y1_}, {x_, y2_}}] :> (Line[{{x, y1}, {x, y2}}] ->
           Line[{x, #} & /@ Range[y1, y2, (y2 - y1)/100]])};
     Graphics3D @@ fullg /.
           GraphicsComplex[pts_,
             others__] :> (graphComplexTemp =
              GraphicsComplex[transFunc /@ pts, others];
             "graphComplexTemp") /.
          axesRules /.
         {Point[pts__] :>
           Point[pts /. {x_?NumericQ, y_?NumericQ} :>
              transFunc[{x, y}]],
          Line[pts__] :>
           Line[pts /. {x_?NumericQ, y_?NumericQ} :>
              transFunc[{x, y}]],
          Arrow[pts__] :>
           Arrow[pts /. {x_?NumericQ, y_?NumericQ} :>
              transFunc[{x, y}]],
          Polygon[pts__] :>
           Polygon[
            pts /. {x_?NumericQ, y_?NumericQ} :> transFunc[{x, y}]],
          Text[txt_, pos_, offset_] :>
           Text[txt, transFunc[pos], offset]} /.
        "graphComplexTemp" -> graphComplexTemp /.
       Hue[__] :> ColorData["Rainbow"][RandomReal[]] /.
      (PlotRange -> _) :> (PlotRange -> All)]
    ] &, Range[1, 2, .3]] //
 Show[#, Axes -> True,(*AxesOrigin->{0,5,0},*)AxesStyle -> Red,
   BoxStyle -> Directive[GrayLevel[.8]], ViewPoint -> {2.5, 1.4, 1.5},
    ViewRange -> All, ViewVertical -> {0, 0, 1},
   SphericalRegion -> True, RotationAction -> "Clip",
   ImageSize -> 950] &


FullGraphicshas many problems. Also it doesn't work that well with all the new (post version 6) graphics functionality. I don't think there's an easy solution (if there is, I'd like to know). $\endgroup$FullGraphicsuses the actual coordinates for aspect-ratio, so you may need to stretch the origin graphics before feeding it toFullGraphics. And it seems to generate ticks withPlotRangePadding->0, which will affect the automatic ticks generation ifPlotRangeis set toAutomatic. About the length of ticks, it looks for me like the default style in old MMA versions (like v4), so my personal guess is, maybe it was forgotten to be adjusted to new default style? $\endgroup$