10
$\begingroup$

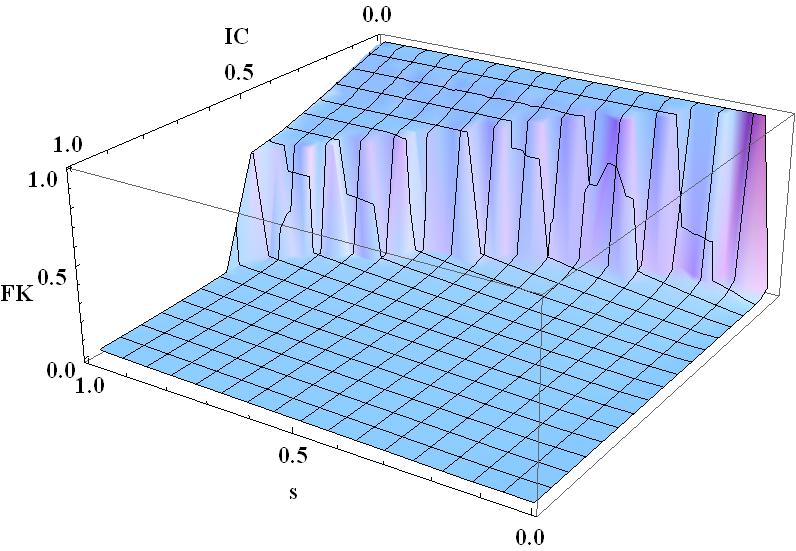
I have a list {(IC,s,FK)}, which I use to generate a 3d-plot with the help of the command ListPlot3D. IC and s go from 0 to 1.

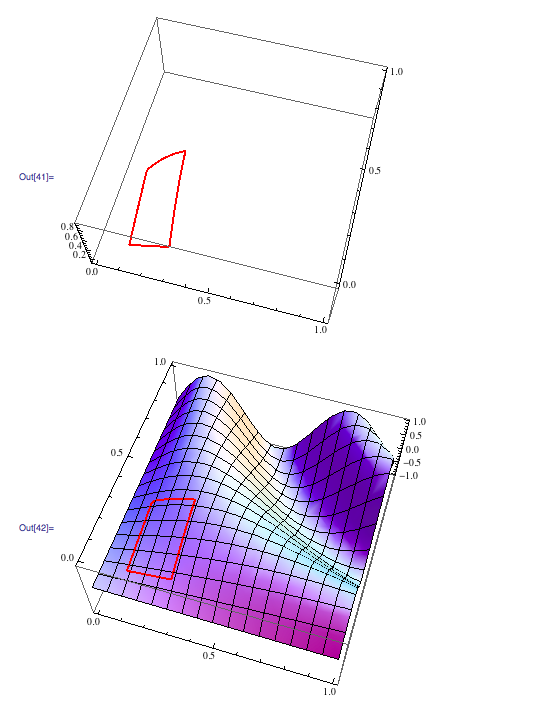
enter image description here

There is an area (lets say 0.11 < IC < 0.3, 0.1 < s < 0.4) which is specially important, because this is the physical range. For some reason I want to plot the whole parameter space, but highlight (for example with a red rectangle) this physical range. It would be great to frame the physical range with a red rectangle on the surface of the 3d-Plot. (In the end, this 2d-rectangle should look similar to these mesh lines, but it should frame the range, defined above).

Do you have any idea?

$\endgroup$
4
  • 1
    $\begingroup$ Please include a self contained example (code) of what you're trying to do. $\endgroup$
    – rm -rf
    Commented Dec 7, 2012 at 21:23
  • $\begingroup$ {(x,y,z)} isn't valid syntax $\endgroup$ Commented Dec 7, 2012 at 21:33
  • $\begingroup$ I took as guess as to what you want and posted below. If it is not correct please use that as a reference to explain what you do want. $\endgroup$
    – Mr.Wizard
    Commented Dec 7, 2012 at 21:49
  • $\begingroup$ I wouldn't try to place a 2D unfilled rectangle parallel to the xy-plane to mark the domain of interest. It would be hard to make it both visible and easy to relate to the data. I think I'd go for superimposing a sub-plot of the same data with different coloring over the domain of interest. Wish I could work this out and post it, but I don't think I'll find the time. $\endgroup$
    – m_goldberg
    Commented Dec 8, 2012 at 0:35

4 Answers 4

10
$\begingroup$

With

 data = Table[{x = RandomReal[{-1, 1}], y = RandomReal[{-1, 1}], x^2 - y^2}, {300}];

Three possible methods are

  1. using ColorFunction
  2. using a combination of Mesh, MeshFunctions and MeshShading, (or, and better yet, just Mesh and MeshShading as in @Brett's answer)
  3. produce two plots using different RegionFunction settings and combine them using Show.

Using ColorFunction:

 ListPlot3D[data, BoxRatios -> Automatic, Mesh -> None, 
  ColorFunction -> Function[{x, y, z}, If[-.5 < x < .5 && -.3 < y < .1, Red, White]],
  ColorFunctionScaling -> False, BoxRatios -> Automatic, 
   MaxPlotPoints -> 100, Lighting -> "Neutral"]
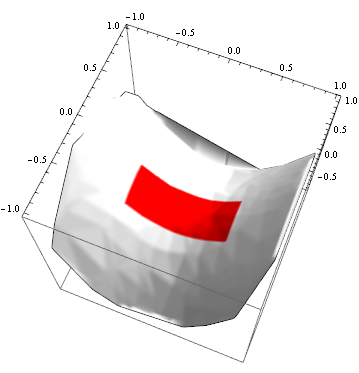
enter image description here

or with a different setting for the ColorFunction, say:

 ColorFunction -> Function[{x, y, z}, If[-.5 < x < .5 && -.3 < y < .1,
    ColorData["DeepSeaColors", (1 + x)/2], Directive[Opacity[.7], Hue[(1 + z)/2]]]]
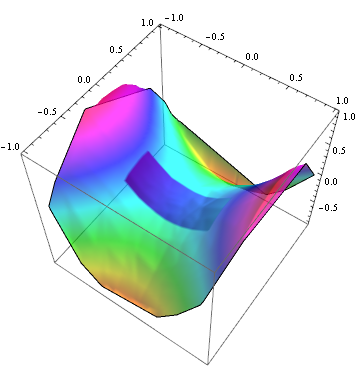
enter image description here

Using Mesh, MeshFunctions and MeshShading:

 ListPlot3D[data,
  MeshFunctions -> {Boole[-.5 < #1 < .5 && -.2 < #2 < .75] &}, 
  Mesh -> {{1}},  MeshShading -> {White, Red}, 
  BoxRatios -> Automatic,  MaxPlotPoints -> 100, Lighting -> "Neutral"]
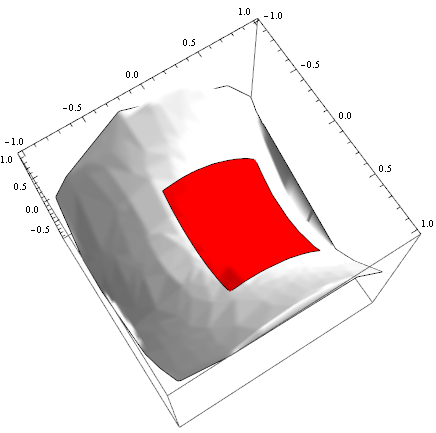
enter image description here

Using RegionFunction and Show:

lp1 = ListPlot3D[data,
    RegionFunction -> (! (-.5 < #1 < .5 && -.2 < #2 < .75) &),
    Mesh -> None, BoxRatios -> 1,
    MaxPlotPoints -> 100, Lighting -> "Neutral",
    ColorFunction -> (Directive[Opacity[.9], Hue[#1]] &), 
    Lighting -> "Neutral",   ImageSize -> 300];
lp2 = ListPlot3D[data,
    RegionFunction -> ((-.5 < #1 < .5 && -.2 < #2 < .75) &),
    Mesh -> None, BoxRatios -> 1,
    MaxPlotPoints -> 100, Lighting -> "Neutral",
    ColorFunction -> (Red &), Lighting -> "Neutral",
    ImageSize -> 300];
    Panel@Row[{lp1, lp2, Show[{lp1, lp2}]}, Spacer[5]]
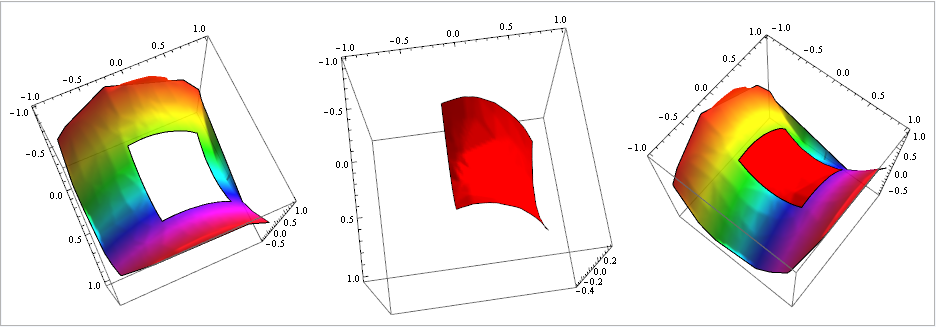
enter image description here

$\endgroup$
5
  • $\begingroup$ lol -- when did that answer get there? +1 $\endgroup$
    – Mr.Wizard
    Commented Dec 7, 2012 at 22:39
  • $\begingroup$ @Mr.W, same here - I should learn to reload the page every 30 secs or so :) Thank you for the vote. $\endgroup$
    – kglr
    Commented Dec 7, 2012 at 23:03
  • $\begingroup$ Great, thanks a lot! $\endgroup$
    – Peter
    Commented Dec 8, 2012 at 12:14
  • $\begingroup$ One last question. I chose solution number one, using 'ColorFunction'. Instead of the color white, I want use my originally blue color. I tried, but could not find the correct Colordata. Do you know it by accident? Would be great! $\endgroup$
    – Peter
    Commented Dec 8, 2012 at 14:26
  • $\begingroup$ @Peter, thanks for the accept. You can try using, say, Lighter@Lighter@Lighter@Blue instead of White inside If. But ... I think it is easier to use the second approach to get the Automatic settings working nicely: just change White to Automatic and remove the Lighting option (or set it to Automatic). $\endgroup$
    – kglr
    Commented Dec 8, 2012 at 23:35
6
$\begingroup$

This can be done with the Mesh family of options.:

dat = Join @@ 
   Table[{x, y, Sin[10 x y]}, {x, 0, 1, 0.05}, {y, 0, 1, 0.05}];

ListPlot3D[dat, Mesh -> {{0.11, 0.3}, {0.1, 0.4}}, MeshStyle -> None, 
 MeshShading -> {{Automatic, Automatic, Automatic}, 
       {Automatic, Directive[Red, Lighting -> "Neutral"], Automatic},   
       {Automatic, Automatic, Automatic}}]

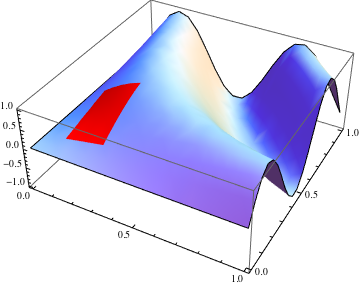
enter image description here

Since your example is in $x-y$ coordinates, we can use the default functions with specific positions, and use MeshStyle -> None to hide the lines (which we probably aren't interested in, in this case.) Then we just have to construct the appropriate setting for MeshShading.

$\endgroup$
1
  • $\begingroup$ Great, thanks a lot! $\endgroup$
    – Peter
    Commented Dec 8, 2012 at 12:13
3
$\begingroup$

Second attempt:

dat = Join @@ Table[{x, y, Sin[10 x y]}, {x, 0, 1, 0.05}, {y, 0, 1, 0.05}];

ListPlot3D[
 dat,
 ColorFunctionScaling -> False,
 ColorFunction -> (If[0.11 < # < 0.3 && 0.1 < #2 < 0.4, Red, Gray] &)
]

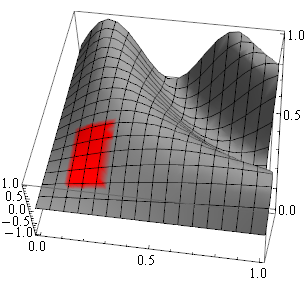
Mathematica graphics

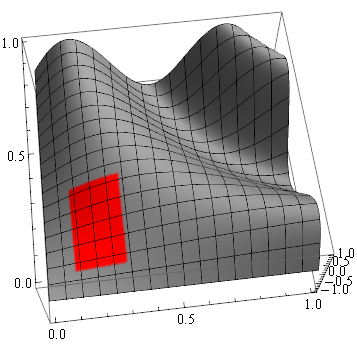
One method to clean up the fuzzy edge:

f = Interpolation[dat];

Plot3D[
 f[x, y], {x, 0, 1}, {y, 0, 1},
 ColorFunctionScaling -> False,
 ColorFunction -> (If[0.11 < # < 0.3 && 0.1 < #2 < 0.4, Red, Gray] &),
 PlotPoints -> 100
]

Mathematica graphics

I seem to remember seeing a better one but I cannot recall it.

$\endgroup$
2
  • $\begingroup$ Thanks for your fast answer. I am looking for a 2d-area on the surface of the 3d-plot. (Similar like these mesh-lines, but only in a certain area and with another color) $\endgroup$
    – Peter
    Commented Dec 7, 2012 at 22:23
  • $\begingroup$ @Peter please see my updated answer and again give feedback. $\endgroup$
    – Mr.Wizard
    Commented Dec 7, 2012 at 22:34
1
$\begingroup$

My solution is using ListPlot3D twice:

data = Join @@ 
   Table[{x, y, Sin[10 x y]}, {x, 0, 1, 0.05}, {y, 0, 1, 0.05}];

g1 = ListPlot3D[data];
g2 = ListPlot3D[data, Mesh -> None, 
  RegionFunction -> 
   Function[{x, y, z}, 0.11 < x < 0.3 && 0.1 < y < .4], 
  BoundaryStyle -> Directive[Red, Thick], PlotStyle -> None, 
  MaxPlotPoints -> 50]

Show[g1, g2]

enter image description here

$\endgroup$
0

Your Answer

By clicking “Post Your Answer”, you agree to our terms of service and acknowledge you have read our privacy policy.

Not the answer you're looking for? Browse other questions tagged or ask your own question.