25
$\begingroup$

I saw a beautiful figure illustrating the optical lattice clock, and would like to make a similar one.

This is the figure (taken from here)
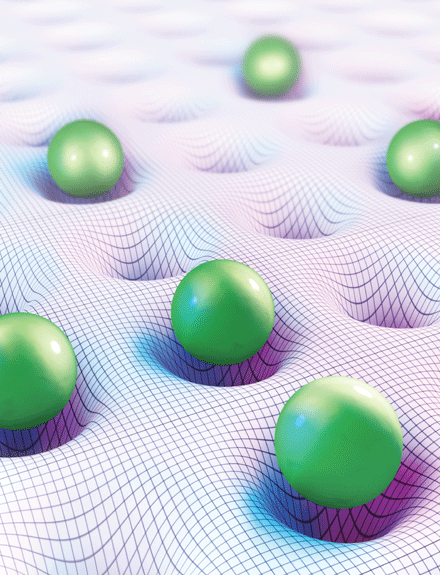
enter image description here

Is it possible to make a similar one using Mathematica?

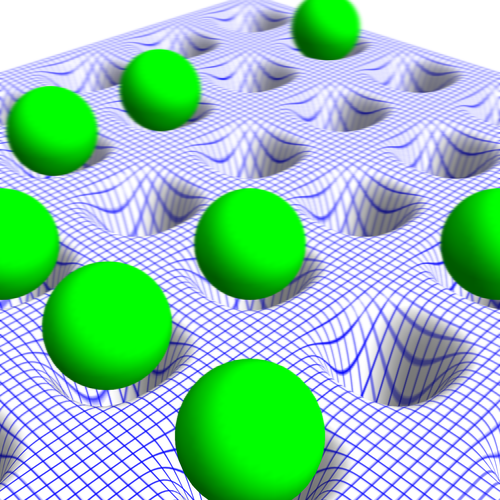
Here is my try:

Show[
 Plot3D[0.05 (Cos[3 x] Cos[
       3 y])^4, {x, -\[Pi], \[Pi]}, {y, -\[Pi], \[Pi]}, 
  PlotRange -> {All, All, {-0.1, 0.1}}, PlotPoints -> 200, Mesh -> 60,
   MeshStyle -> Gray, 
  ColorFunction -> (ColorData["GreenPinkTones"][0.5 #3 + 0.5] &)],
 Graphics3D[{Darker[Green], 
   Scale[Sphere[{0, 0, -0.5}], 
    0.25 {\[Pi]/3, \[Pi]/3, .1}, {0, 0, 0}]}, Lighting -> "Neutral"],
 ImageSize -> {651.1743427005708`, 484.8`}, Lighting -> "Neutral", 
 Method -> {"RotationControl" -> "Globe", 
   "RotationControl" -> "Globe"}, 
 PlotRange -> {All, All, {-0.1`, 0.1`}}, 
 PlotRangePadding -> {Automatic, Automatic, Automatic}, 
 ViewAngle -> 0.13079882249358044`, 
 ViewCenter -> {{0.5`, 0.5`, 0.5`}, {0.5218420229698426`, 
    0.6543497570242808`}}, 
 ViewPoint -> {-2.144844931539977`, 
   1.84186142553857`, -1.8593511526229505`}, 
 ViewVertical -> {0.`, 0.`, -1.`}]
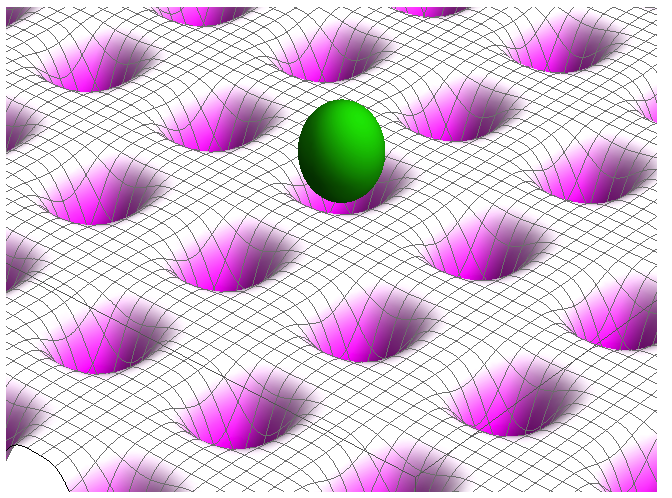
enter image description here

$\endgroup$
5
  • $\begingroup$ Urrmmm. The question was whether it was possible to draw such a picture in Mathematica, and you answer it yourself by drawing it. What kind of additional answers do you expect? $\endgroup$ Commented Nov 30, 2013 at 21:55
  • $\begingroup$ @SjoerdC.deVries nicer :p :) $\endgroup$
    – Kuba
    Commented Nov 30, 2013 at 22:03
  • $\begingroup$ @SjoerdC.deVries maybe beautiful shadows, focus with fade out, nice colors, textures... :) But I believe that to do what xslittlegrass wants, he has to go to a render program like Unit3D or something equivalently. $\endgroup$
    – Murta
    Commented Nov 30, 2013 at 22:06
  • $\begingroup$ @Murta Indeed. Mathematica has no built-in cast shadows. It can be simulated as shown here.Same with focus, which could be simulated with image blurring. $\endgroup$ Commented Nov 30, 2013 at 22:22
  • $\begingroup$ Your reference image was probably produced by a renderer with more features than Mathematica's, given the the shadows and depth of field, though they could have been faked. If you are interested in producing "pretty" 3D renderings I think you should consider exporting to an external renderer such as POVray. (Old school.) $\endgroup$
    – Mr.Wizard
    Commented Dec 1, 2013 at 11:34

3 Answers 3

23
$\begingroup$

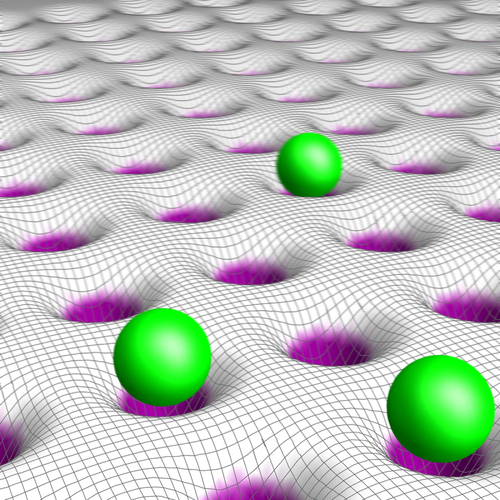
My pc is rather old so there was not much I could do. Maybe no as pretty as in the link but I'm happy because of the result:

r = 35;
p = Show[
     Plot3D[-Sum[2 Exp[-((x - xo)^2 + (y - yo)^2)], {xo, -24, 8, 4}, {yo, -28, 8, 4}],
            {x, -r, r - 4}, {y, -r, r - 4}, Evaluated -> True, 
            PlotRange -> All, PlotPoints -> 200, Mesh -> 300, ImageSize -> 800,
            ColorFunction -> (Blend[{White, White, White, Purple}, -#3] &), 
            ColorFunctionScaling -> False, MeshStyle -> Directive[Thick, [email protected]]
           ],
     Graphics3D[{Specularity[White, 15], Green, Sphere[{{-4, -4, .2}, {4, 4, .2},
                                                        {0, 8, .2}}, 1]}
           ],
     BoxRatios -> Automatic, Boxed -> False, Axes -> False, Lighting -> "Neutral",     
     ViewVector -> {{10, 20, 11}, {0, 0, 0}}, ViewAngle -> .5];

p = ImageResize[Rasterize[p, "Image", ImageResolution -> 3 72], Scaled[1/3]]

manual blurring :)

Table[ImageTake[p, {799 - i, 800 - i}, All] ~ Blur ~ (i/100),
      {i, 0, 798,2}] // Reverse // Transpose[{#}] & // ImageAssemble

enter image description here

I decided to not play with shadows because there is no easy way and my pc nearly died :)

$\endgroup$
3
  • $\begingroup$ Hi Cuba, nice job as always.Which environment do you think the original picture got created? $\endgroup$
    – Alex
    Commented Nov 30, 2013 at 23:35
  • $\begingroup$ @Alex Hello, thank you :) I have no idea, I have no experience with graphics/visualisations software :) $\endgroup$
    – Kuba
    Commented Nov 30, 2013 at 23:40
  • $\begingroup$ Nice "tilt-shift" blurring, +1 :) $\endgroup$
    – ybeltukov
    Commented Dec 1, 2013 at 0:59
14
$\begingroup$

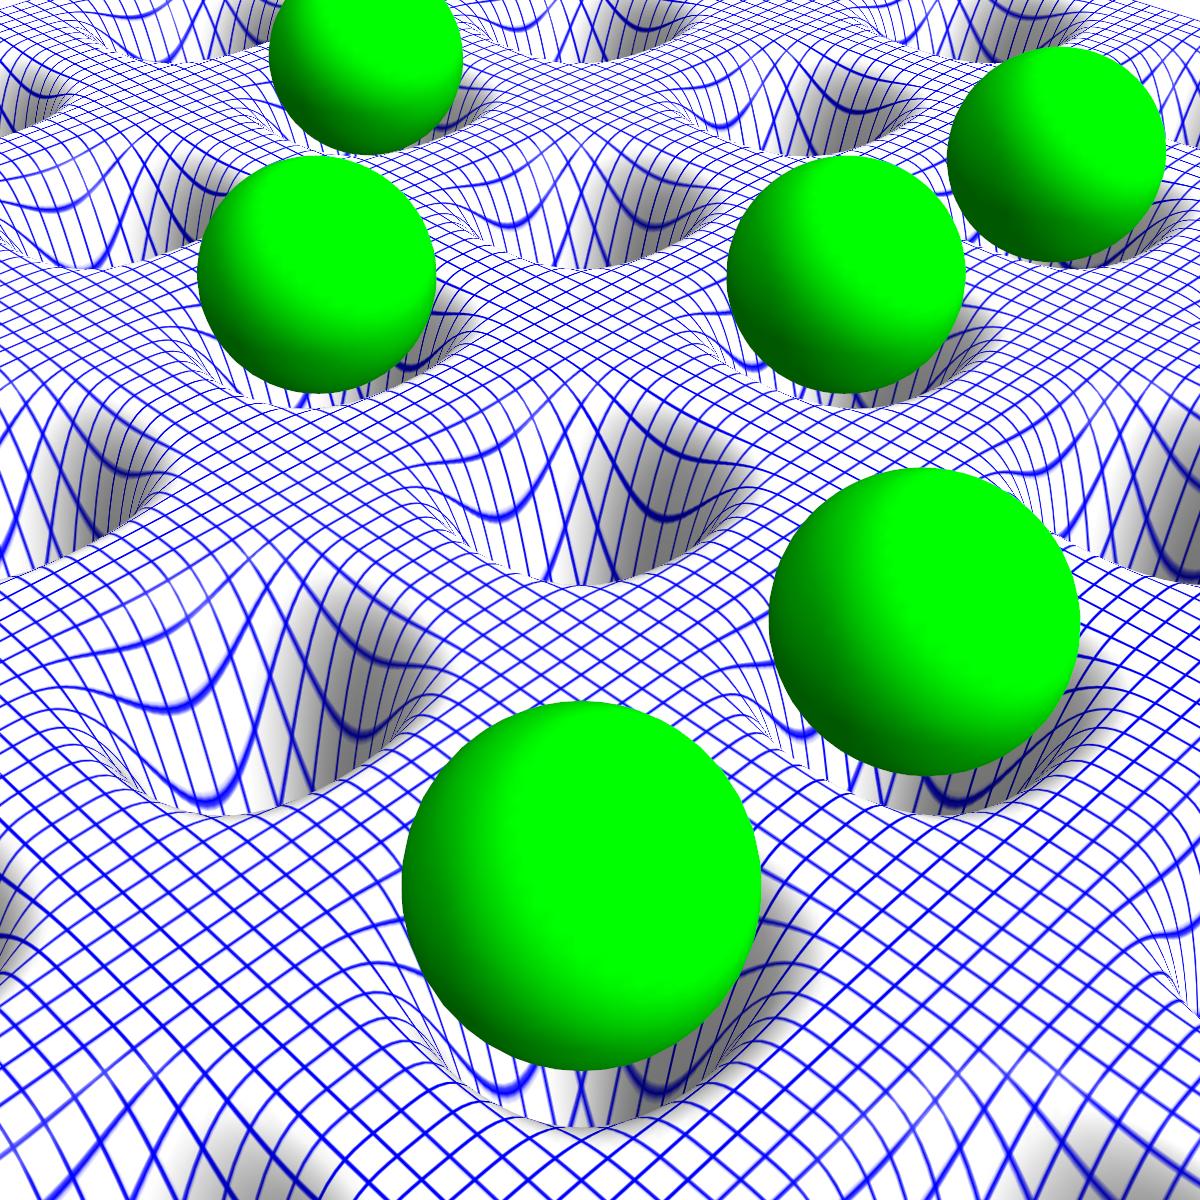
I noticed in the original picture that the raster looks like it's painted on a rubber membrane which is stretched. You can create this effect by using Texture:

img = Image[
   Graphics[
    {
     Blue, Thickness[0.001],
     Table[Line[{{i, 0}, {i, 100}}], {i, 0, 100, 1}],
     Table[Line[{{0, i}, {100, i}}], {i, 0, 100, 1}]
    }, PlotRangePadding -> 0
   ], ImageSize -> 2000, ImageResolution -> 2000];

Show[
 ParametricPlot3D[
  {u, v, -2 Cos[2 u]^4 Cos[2 v]^4}, {u, 0.25 \[Pi], 3.25 Pi}, {v,0.25 \[Pi], 3.25 \[Pi]}, 
  PlotStyle -> Directive[Specularity[White, 100], 
  Texture[img]],
  TextureCoordinateFunction -> ({#1, #2} &), 
  Lighting -> "Neutral", Mesh -> None, PlotRange -> All, 
  PlotPoints -> 300, 
  Boxed -> False, Axes -> None],
 Graphics3D[
   {Green, Sphere[{#1 \[Pi]/2, #2 \[Pi]/2, 0.2}, .5] & @@@ 
             RandomChoice[Flatten[Table[{i, j}, {i, 5}, {j, 5}], 1], 10]
   }], 
   ImageSize -> 1200, ViewPoint -> {1/2, 1/2, 1/2}
 ]

Mathematica graphics

enter image description here

$\endgroup$
13
  • $\begingroup$ Nice "mesh" :). $\endgroup$
    – Kuba
    Commented Nov 30, 2013 at 23:13
  • $\begingroup$ @kuba Thanks, I'm less satisfied with the way Mathematica draws the spheres. The highlight boundaries are too irregular for my taste. $\endgroup$ Commented Nov 30, 2013 at 23:16
  • $\begingroup$ Yes, OP's spheres are more realistic. I've added blurring using my code, feel free to revert it :) $\endgroup$
    – Kuba
    Commented Nov 30, 2013 at 23:23
  • $\begingroup$ I was thinking about ImageEffect with "PoissonNoise" too. $\endgroup$
    – Kuba
    Commented Nov 30, 2013 at 23:40
  • 1
    $\begingroup$ @Kuba Thanks, did not notice that. Additional information is available on the bottom of the tutorial/ThreeDimensionalGraphicsPrimitives page and here. $\endgroup$ Commented Dec 1, 2013 at 8:18
0
$\begingroup$

Would n't the simple egg-crate suffice?

Plot3D[- Sin[x]^4 Sin[y]^4, {x, -3 Pi, 3 Pi }, {y, -2 Pi, 2 Pi },
PlotRange -> {-5, 5}, Mesh -> {80, 80}, Axes -> None, Boxed -> False, PlotStyle -> Yellow]

$\endgroup$

Your Answer

By clicking “Post Your Answer”, you agree to our terms of service and acknowledge you have read our privacy policy.

Not the answer you're looking for? Browse other questions tagged or ask your own question.